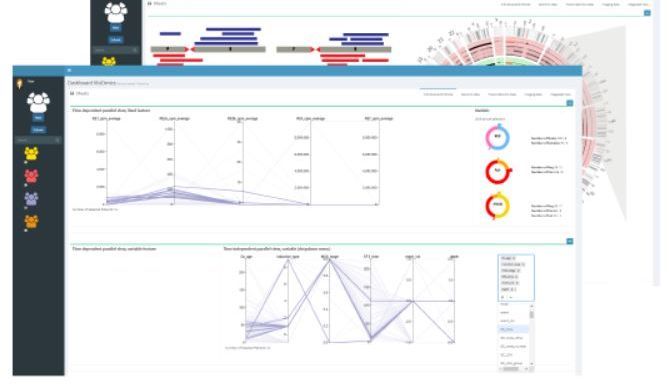
Within the framework of the FFG COIN project VISIOMICS, a web-based platform for integrated exploration of multi-omics and clinical data was created by VRVis in cooperation with St. Anna Kinderkrebsforschung (Paediatric Cancer Research) and other partners in Vienna, which combines visual and automatic data analysis. A research objective is the classification of tumours as well as patient-specific risk stratification and survival prediction. Full integration of multi-scalar genome-wide (multi-omics) data sets, such as cellular features, genomics, gene expression and/or epigenetic data with clinical data, supports exploration into types of cancer in the patient context, therefore helping to improve individual cancer diagnosis precisely in rare types of cancer. While machine and deep learning approaches depend on a larger data stock to learn models, the platform developed by VRVis for visual data exploration represents an alternative especially for rare types of cancer (for which there are only few data sets available) so that researchers can analyse complex relationships and develop new hypotheses.

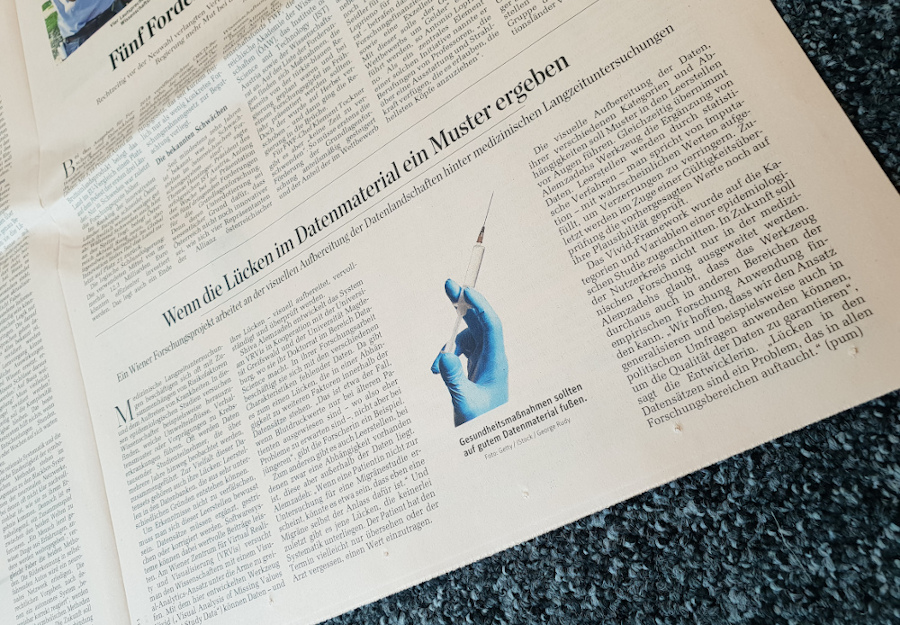
Medical long-term studies are often concerned with the relationships between risk factors and incidence of diseases. Large volumes of data are accumulated yet, at the same time, one of the biggest challenges is the lack of data. The dropout of patients and non-recorded values are among the main statistical problems in analysing long-term studies. If they are not correctly handled, they cause a bias in data analysis, thus reducing the statistical significance and therefore the value of the results. Together with epidemiologists at the University of Greifswald, a visual analytics application was developed with VIVID, and this allows missing values to be traced in clinical cohort studies and their character determined. VIVID also integrates methods to replace missing data and to evaluate its validity. VIVID was developed by our scientific partners at the University of Magdeburg in collaboration with VRVis.

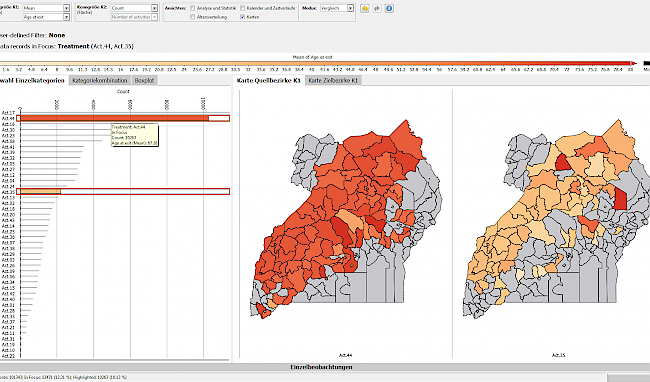
Data from the healthcare system has the potential to be an important decision-making aid. At VRVis, we use visual data analysis and explore new visualization technologies to support the process of data-driven modeling in the healthcare context. We combine decision analysis, data security, data management, statistics, mathematical modeling, simulation and visual analysis. The combination of these methods helps, for example, to analyze and model the spread of diseases in the population, to examine treatment pathways and to investigate the effects of changes in the healthcare system on the basis of computer models. More information about our project DEXHELPP.

The combination of "liquid biopsies", machine learning and data visualization aims to enable earlier and more accurate prediction of a relapse in children with cancer.

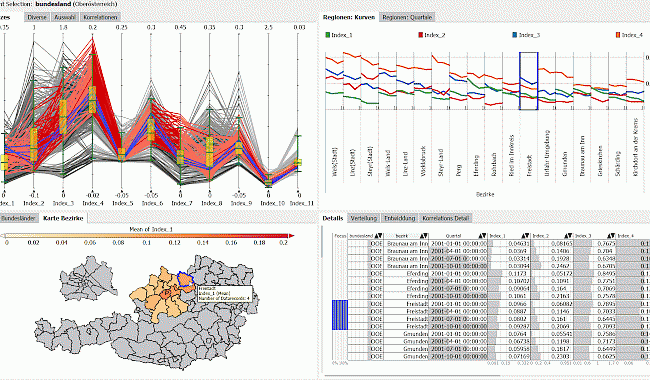
DEXHELPP develops new methods to support analysis, planning and control in health care by combining decision analysis, data security, data management, statistics, mathematical modelling, simulation and visual analysis.