

We approached the challenge of putting the quality assurance of an Austrian manufacturer of glass articles on a new AI footing with the clear goal of optimization. In this joint project, methods from the fields of visual analytics and machine learning were researched and adapted in order to automate quality control and assurance in the production of glass articles. Now even the smallest damages or imperfections can be detected automatically without any problems.
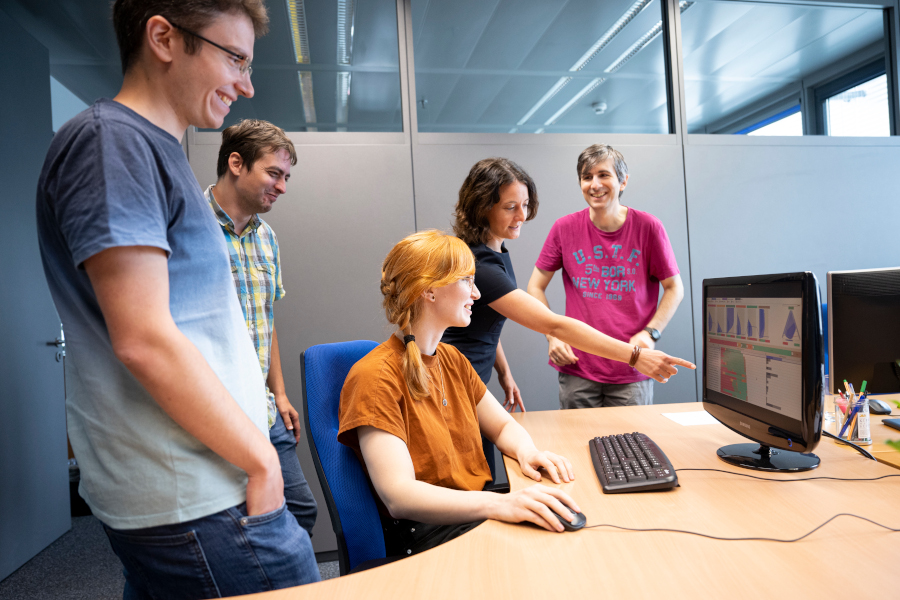
The visual computing platform TSM Visuals, developed together with our company partner HAKOM Time Series GmbH and data scientists from the energy industry, opens up brand new possibilities for exploration, interpretation, and evaluation of large and heterogeneous data using simultaneous interactive visualizations. Such an analysis provides trustworthy results in the quality assessment of data and guarantees better quality assurance of complex processes.
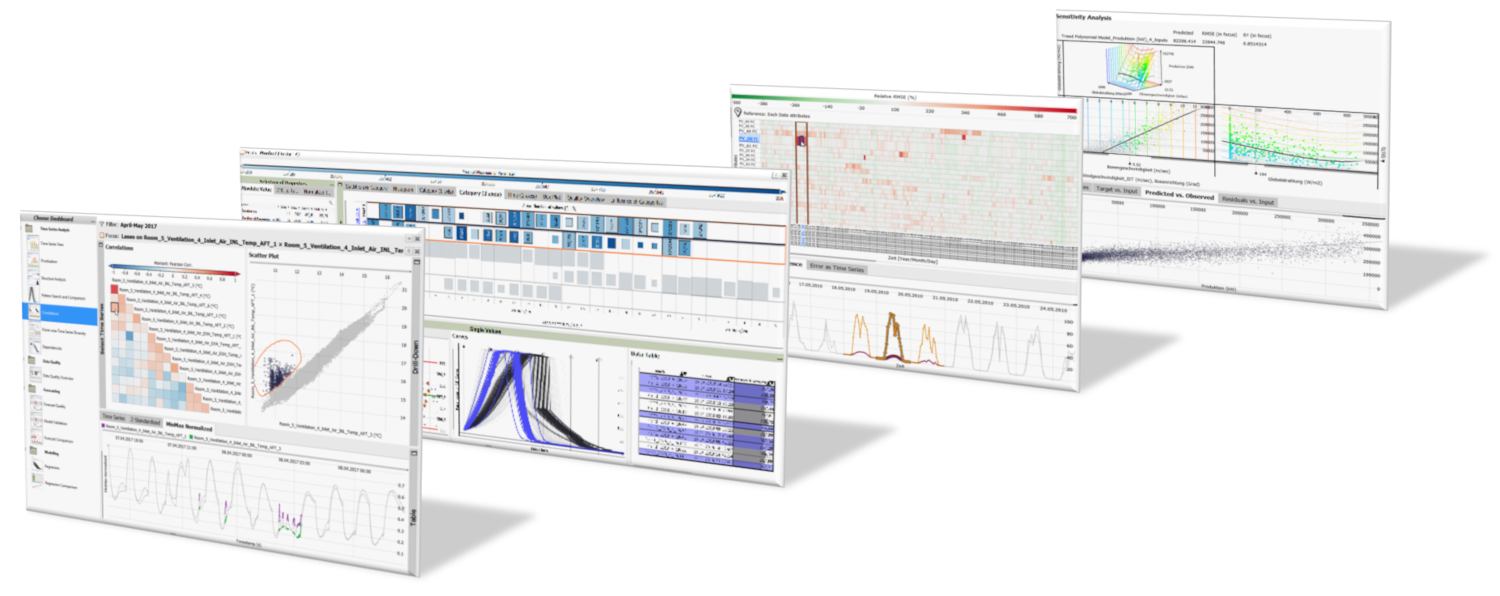
Data science and visual analytics offer the possibility of forecasting future results by means of different display types and predictive modelling based on real data. In our research project En2VA, we further developed an existing analysis platform into a potent communication tool for joint workshops of data scientists and experts, and optimized the processing of extremely large data volumes with millions of entries. This makes En2VA the ideal visual analytics solution for industry 4.0, for instance in the area of simulation-based product development, which allows for both the testing of data quality and the creation of forecast models and their evaluation in a quick and easily understandable way.
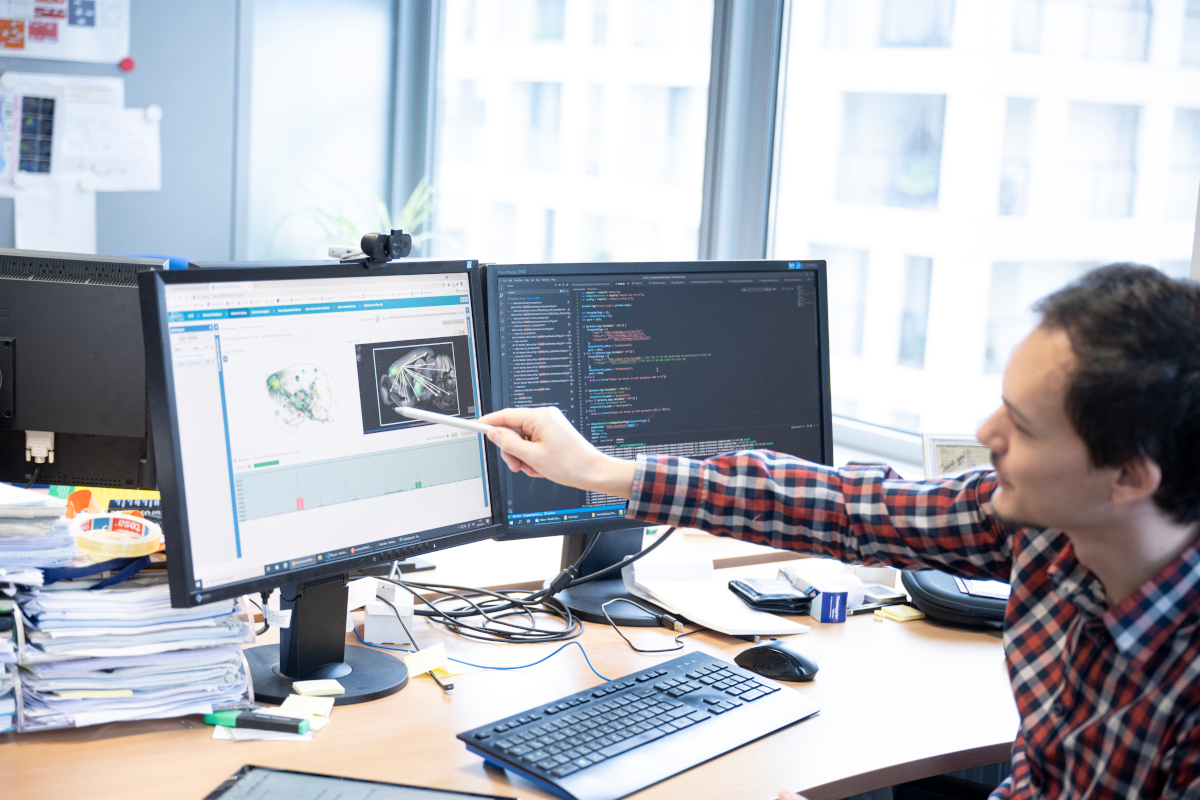
Advanced mathematical methods, e.g. from the field of Machine Learning, are helpful tools in neuroscience, in particular to better understand the highly complex information processing of the brain. Our software framework Brain* offers web-based solutions for management, visualization, automatic information extraction as well as semantic and image-based search in very large collections of spatial image and network data. The unique selling proposition of our infrastructure are high-performance spatial data structures that allow searching the contents of tens of thousands of 3D image data and very large, dense network data in milliseconds.
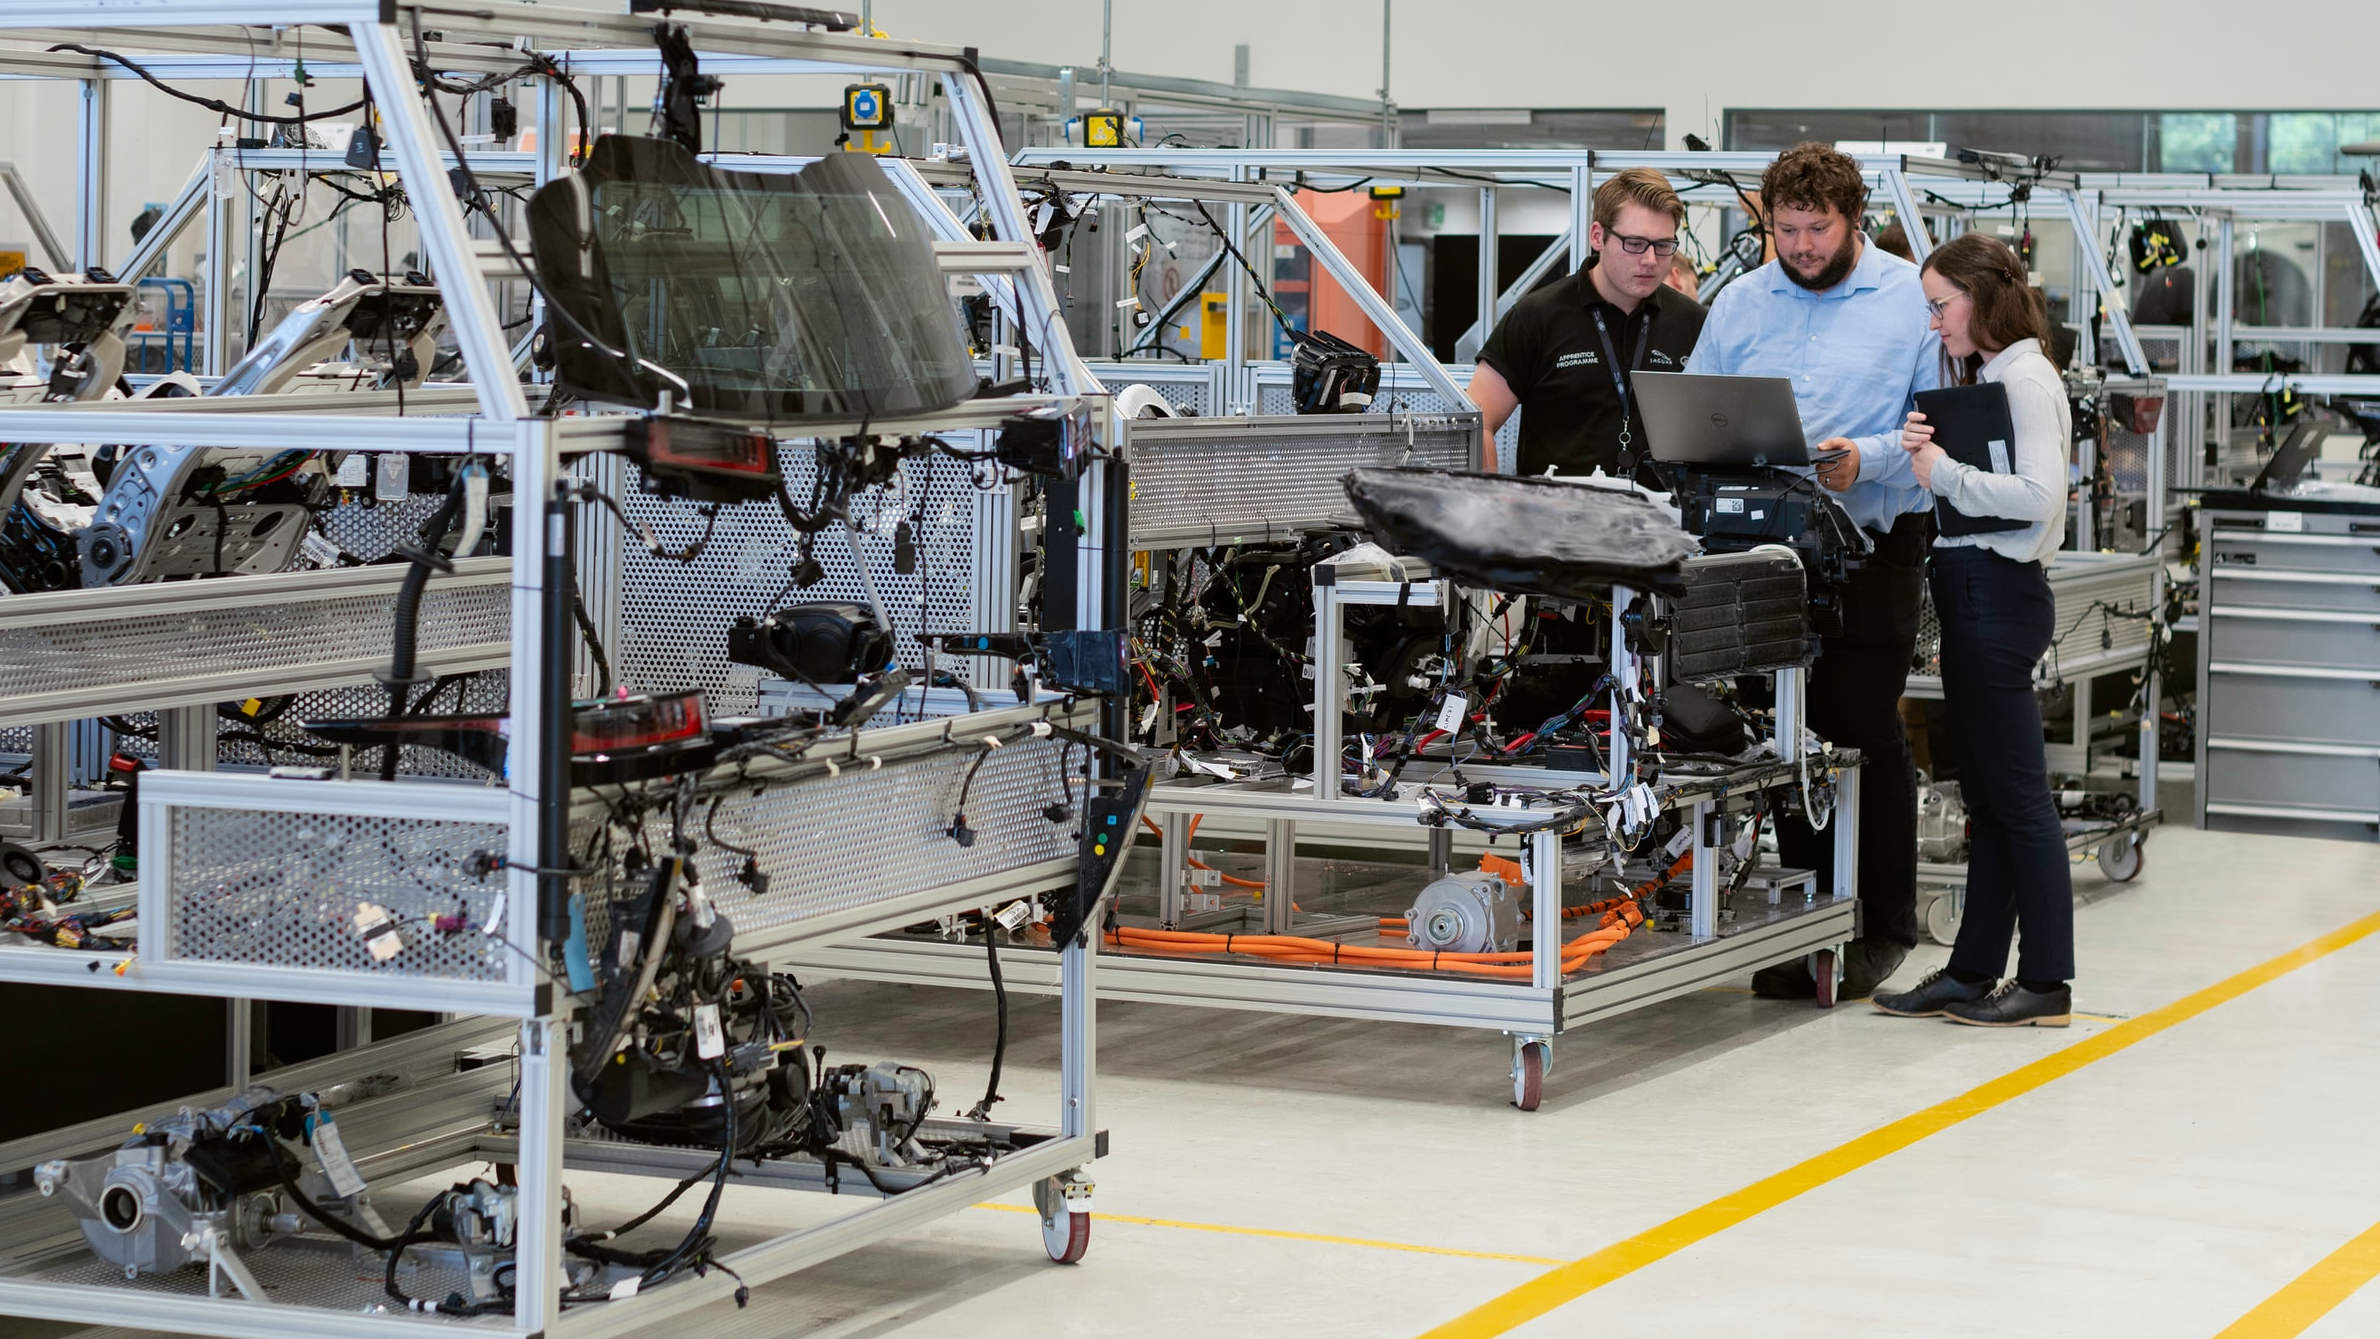
As a key technology in the field of industrial production, visual analytics enables us to see through the data surrounding the production process through visual data analysis. In this context, the stability and scalability of visual analytics tools are crucial factors for their acceptance as reliable tools in Industry 4.0, such as in our INGRESS project. Our analytics solutions are characterized by their ability to handle complex data, as well as to perform pattern search and anomaly detection quickly and reliably. In the EDIH AI5production project we support companies in their digital transformation with know-how about human-centered AI and data science solutions.
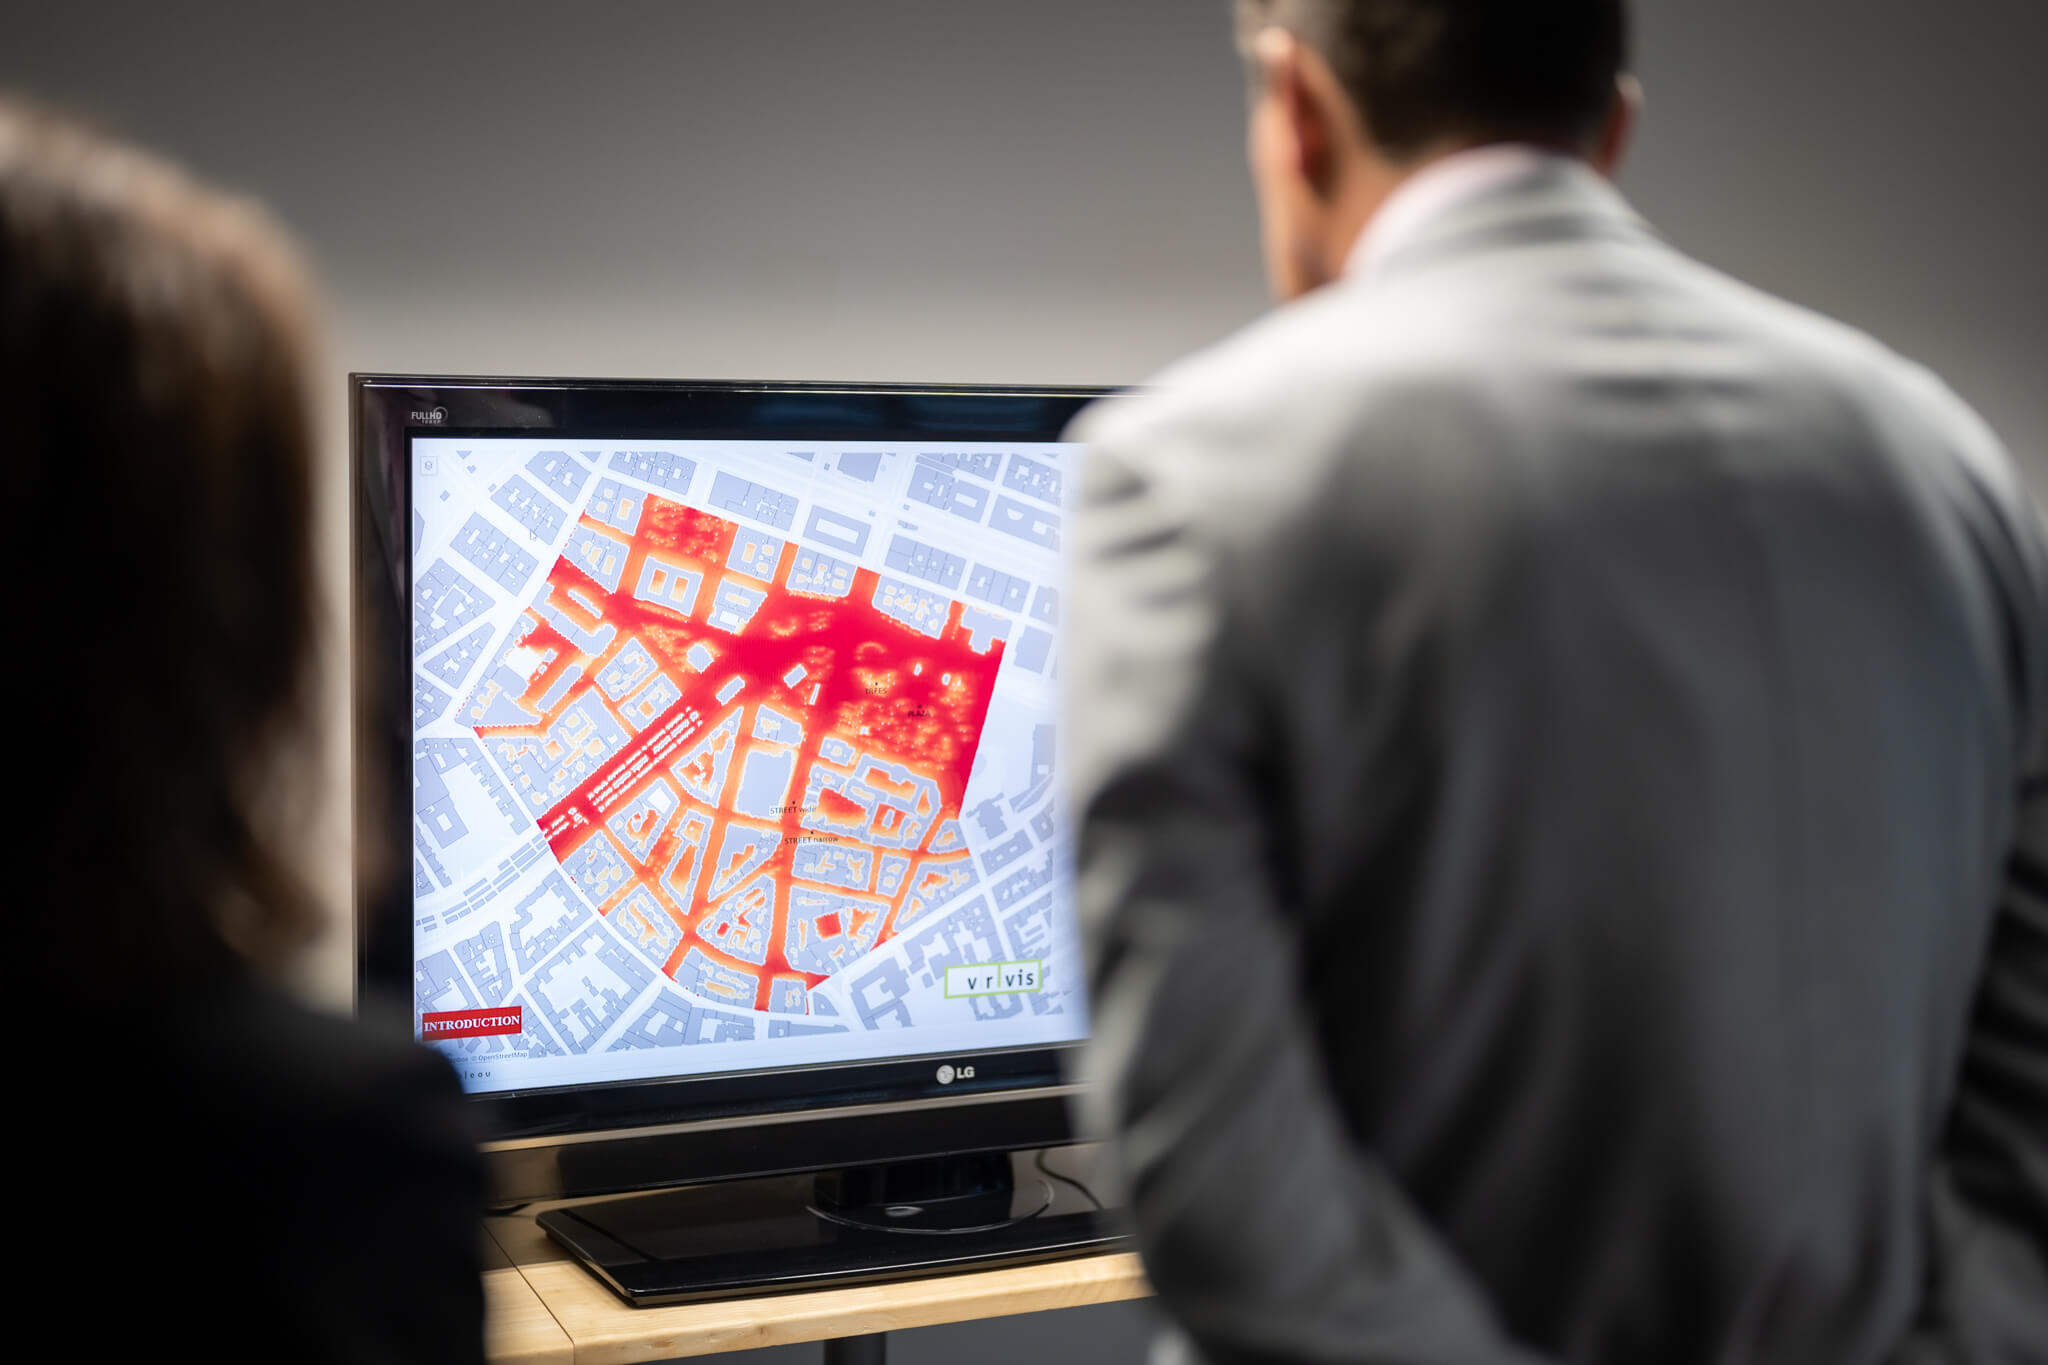
The role of visual analytics in the analysis of climate and weather data will be an even greater one in the future, as it is the only way to capture the complex interrelationships in their entirety and use them for better climate change adaptation solutions. VRVis has several experts specialized in climate and environmental data, for example working with Typical Meterological Year (TMY) time series or developing visual cockpits for biosolar technology performance assessment.

The primary goal of project INGRESS is to accelerate and improve the process of data scientists working with Industry 4.0 and Internet of Things (IoT) data, by enabling a closer integration of visual analysis into the existing workflows.

The RAILING project deals with the research and development of interactive, scalable and trust-building visualization and analysis tools for the exploration of time-dependent and complex data.

Training AI algorithms requires a great amount of data. However, raw data often contains sensitive information. Homomorphic encryption offers a solution for secure machine learning - with protected sensitive data.

DEXHELPP develops new methods to support analysis, planning and control in health care by combining decision analysis, data security, data management, statistics, mathematical modelling, simulation and visual analysis.

Businesses go smart with Data Science: with the help of visual data analysis, machine learning, deep learning, data mining and visual data processing we help companies to fully exploit the potential of their data.

In this project we develop new methods from the field of visual analysis and machine learning to automate the quality control and quality assurance of glass articles.