

In life science research, images are one of the most important methods of data acquisition. This image data is becoming ever larger and more complex due to ongoing rapid technical developments. Handling multi-dimensional, multi-channel and/or time-dependent image data as well as complete image data collections that can be extremely large is not an insignificant task, and increasingly leads to bottlenecks in data analysis. Image data contains a lot of information which often cannot be directly quantified or recorded and requires much time and expertise in its use.
The main focus of research of the Biomedical Image Informatics Group at VRVis is the extraction, correlation, visualisation and provision of this information and combining it with further experimental, genetic and/or demographic data with methods pertaining to image analysis, artificial intelligence and data science.
Correlative Imaging

Nowadays, large volumes of often very heterogeneous data, such as multi-omics data, clinical and demographic data, image and sensor data, or data from behavioural experiments, increasingly form the basis for life science research and medical diagnosis. Preparing and integrating this data plus the option of analysing, visualising and intuitively searching through this data in its full context is one of the biggest challenges confronting researchers today.
VRVis has already had success in developing tailor-made data science and AI solutions for the analysis of complex data in life sciences focussing on neuroscience, cancer research and biology. In order to be able to handle the increasing size and complexity of the data in an efficient manner, we have developed extremely optimised, high-quality parallel analysis methods. The use of high-performance computing (HPC) infrastructures enables effective analysis of huge data sets.
We use visual-analytical methods to support researchers in investigating data and developing first hypotheses, and as an alternative if too little data is available and if this data is too diverse for machine or deep learning to be used for building models. For this, we are not just involved in the design of visual analytics applications that most effectively solve scientific questions but also in the associated data preparation, statistical analyses and indexing, as well as development of high-performance data structures to ensure interactive handling of the data.
Visual Analytics and Data Science for Healthcare and Medical Research
Visual Computing and Data Science for Biology
Good data management will become increasingly important for efficient research in the life sciences due to the rapid development of measurement methods, genetic tools and imaging methods that enable ever faster screening of biological problems at different levels and activity stages. Professional solutions for data management, integrated with efficient and intuitive data visualisation, and high-performance options for targeted mining and data analysis, have already been successfully developed by VRVis on several occasions for accelerating research projects in the field of life sciences.

An important feature of modern data-driven science is that results are reproduced, verified and used as the basis for further research. In the past, a lot of (publicly) financed research was conducted in a kind of vacuum: Although research data was compiled, it was rarely exchanged and might have been forgotten about relatively quickly after the project. This approach is not only costly but also hinders cooperation and progress.
Based on Brain*, VRVis has already created several platforms for publishing research data. Through web-based access, the high-performance search function and high-quality visualisation of data, we are using our solutions to support the open research data concepts through intuitive and targeted access to research data, which extends well beyond simply “storing” data sets.
The movement and behavior patterns of humans and animals are important sources of knowledge in the life sciences. The resulting movement paths, also called trajectories, together with temporal-spatial contexts generate a large amount of complex, heterogeneous data sets. For researchers, it is essential to be given tools with which they can process and analyze these data in a practical way. VRVis has been developing specialized interactive visualization methods for this purpose for many years. Depending on the application, these methods enable automatic and interactive analyses and are often also linked to machine learning and deep learning techniques.

The tools of Extended Reality – Augmented Reality (AR) and Virtual Reality (VR) – are being used more and more often in the Life Sciences. Digital Realities help enhance scientific experiments, trainings and procedures by creating cheap and controllable immersive environments true to reality.
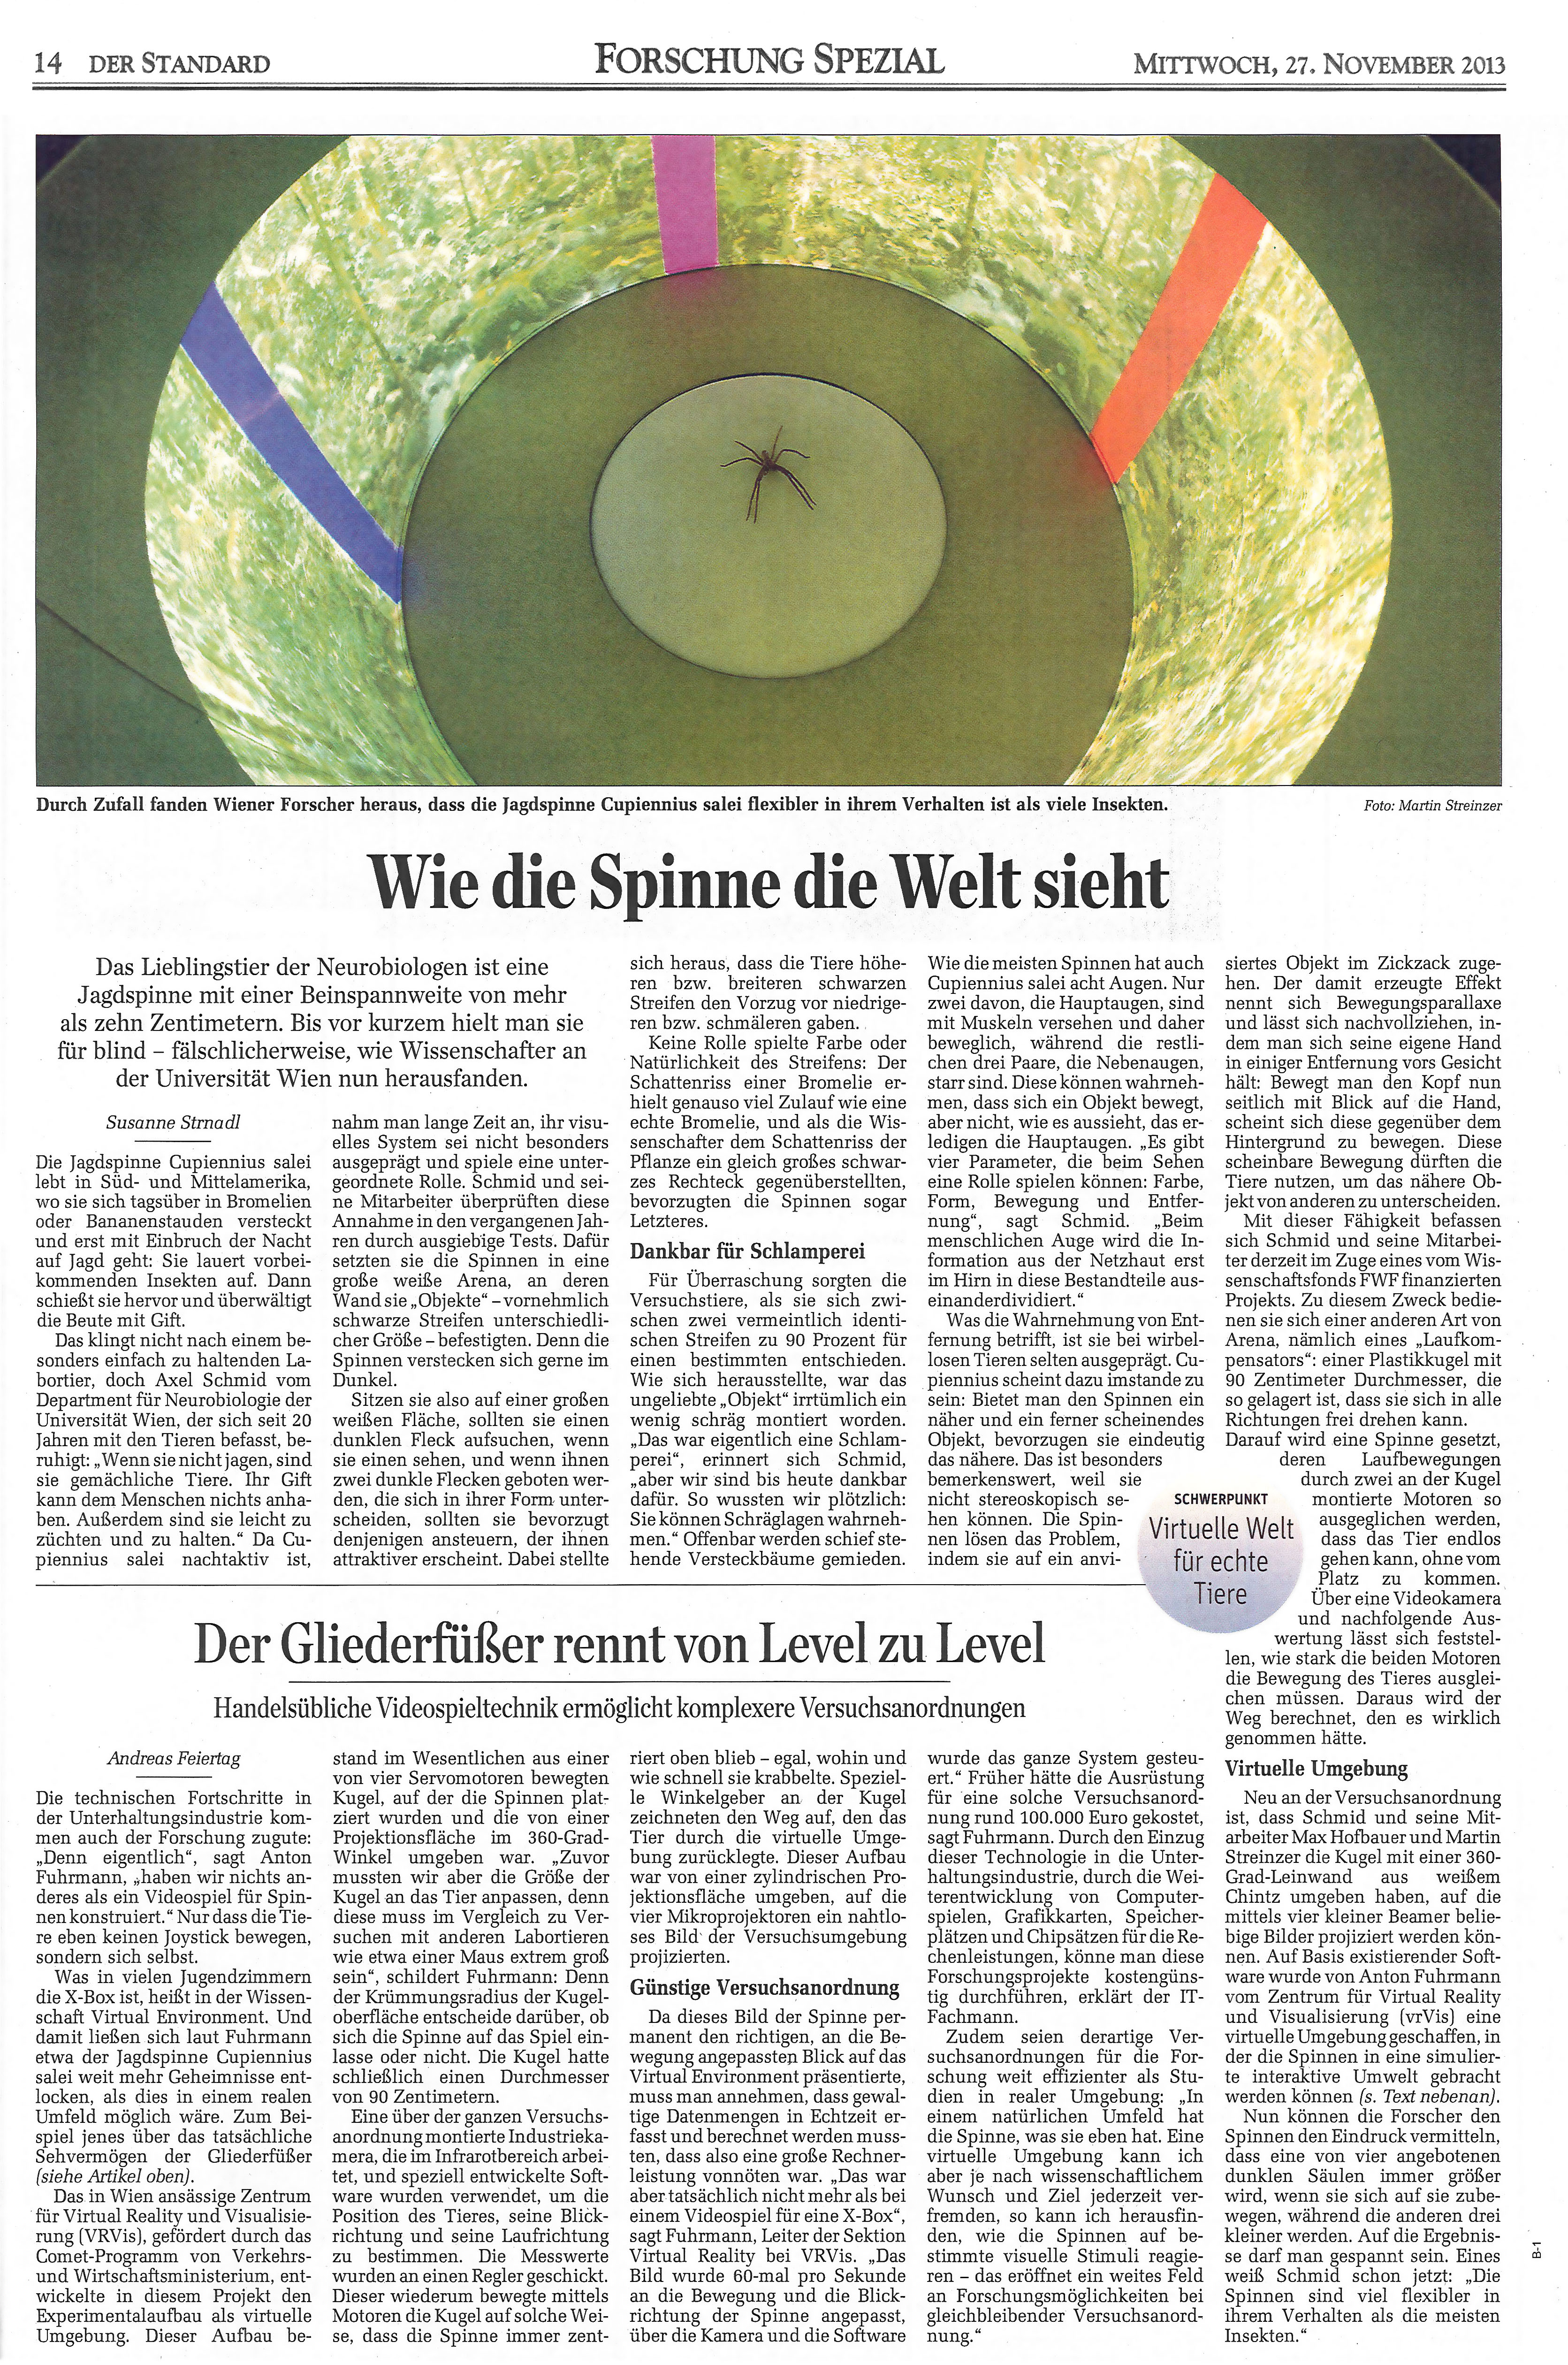
For the department of Neurobiology at the University of Vienna VRVis created a setup for the research into the reactions of hunting spiders. The spider moves on a ball of about one meter in diameter inside a projected virtual environment. A camera picks up on the movements and the ball is rotated accordingly, so that the spider always remains in the center of the setup. In this manner, various visual stimulations can be produced in correlation with spider movements, even ones, that would not be possible in a purely physical setup.
References

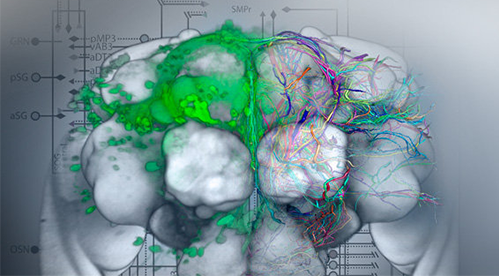
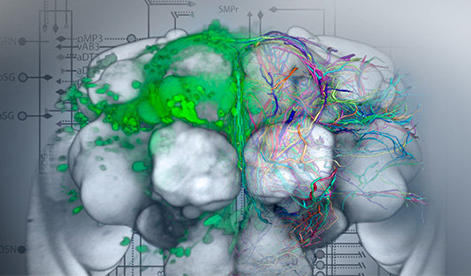
Within the project Larvalbrain 2.0, a dynamic multi-scale multi-level atlas and data collection of structural, molecular, physiological, and behavioral results of Drosophila melanogaster larvae will be established.

Understanding how the brain works is one of the biggest challenges addressed by neuroscientists today. Modern neuroscience research is extremely data-intensive and requires special software infrastructures to enable and accelerate the discovery of the complex interplay of genes, structure and function.

For centuries, neuroscientists have been mapping the brain. Until now, the step from simple maps to a generally accepted model has proved to be extremely difficult. In this project, a 4D atlas of the brain of the fruit fly larva is being built.
