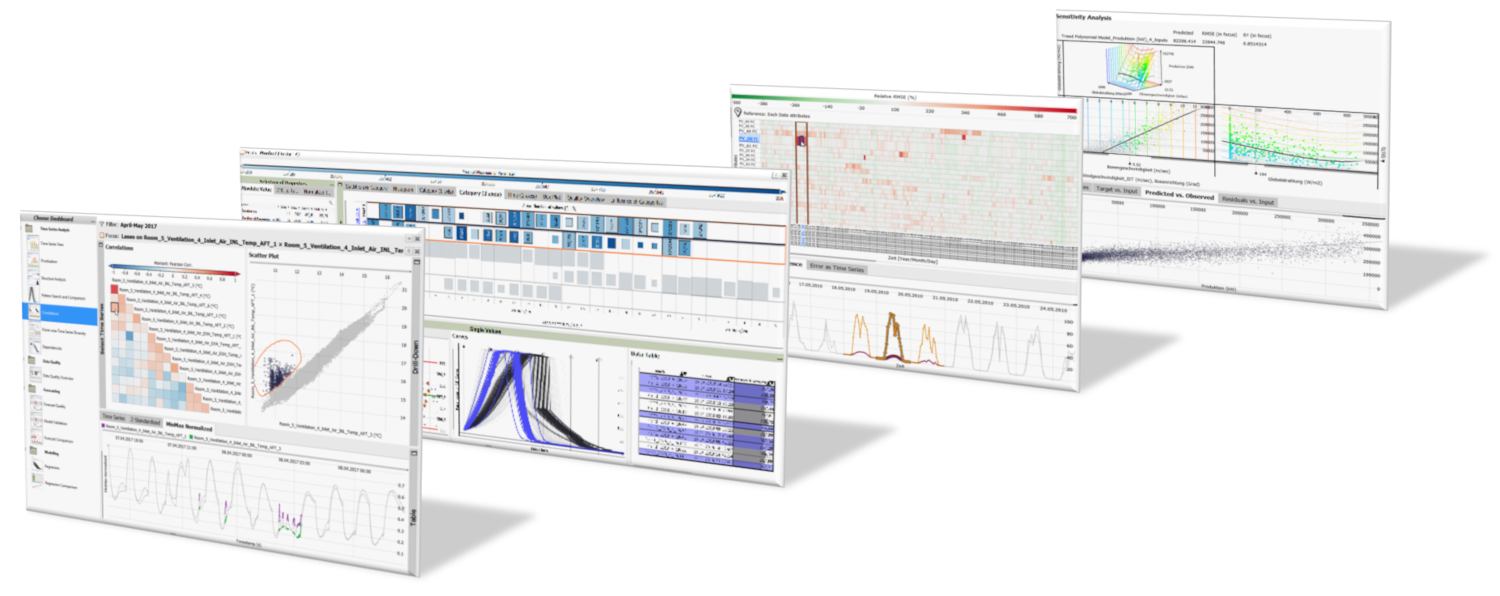

Examples of typical areas of application are data plausibility checks, support for statistical modelling, e.g. for the validation and selection of forecast models, and sensitivity analysis of key figures with regard to the changes in parameters.
We developed Visplore over many years in our research work together with renowned companies such as AVL, APG Austrian Power Grid, HAKOM Time Series GmbH, RHI Magnesita, Wien Energie or the Hauptverband österreichischer Sozialversicherungsträger. There are more than 25 scientific papers in high-calibre publications about the powerful visual analytics tool Visplore, several of these publications have also received awards. The software forms the basis for many of our basic research projects as well as use cases in applied industrial research. Visplore has been developed further since July 2020 in a spin-off founded by former VRVis employees.
Licensing information as well as information about collaborating in a joint research project based on Visual Data Analytics and Visplore is available on request. Please contact Gerd Hesina at products(at)vrvis.at.
For inquiries regarding Visplore standard software packages, please contact DI Dr. Harald Piringer at hp(at)visplore.com. More information about Visplore as standard software can be found at www.visplore.com.

