

Visual analysis of intra-urban microclimate conditions
Visually comprehensive and easily understandable representation of intra-urban microclimate conditions supports urban planners, researchers and policymakers in making informed decisions aimed at shaping sustainable and climate-resilient habitats. We are actively advancing this mission by developing visual analytics solutions designed to analyze and interpret intricate microclimate data by identifying hotspots, cool zones, and areas susceptible to dynamic thermal changes, providing a foundation for targeted interventions.

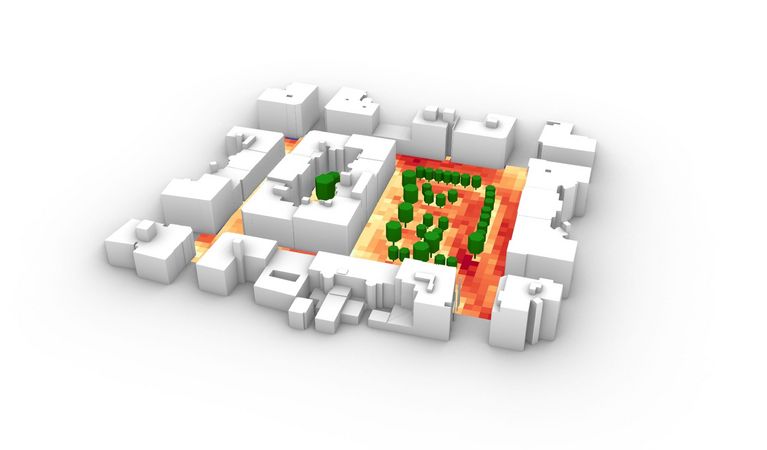
Outdoor Thermal Comfort Mapping
Outdoor thermal comfort is a crucial factor affecting human health, well-being and the overall livability of urban areas. However, continuous shifts in weather patterns and atmospheric conditions are increasingly distorting the distinction between thermal discomfort and thermal stress. Outdoor thermal discomfort and especially the heat stress are severe health concerns that critically affect how people use and navigate outdoor spaces, ultimately making cities dysfunctional. To advance the understanding of spatial distributions of thermal conditions, we are developing dynamic visual solutions to identify patterns, trends and seasonal variations in outdoor thermal comfort.
Visual analytics of climate data
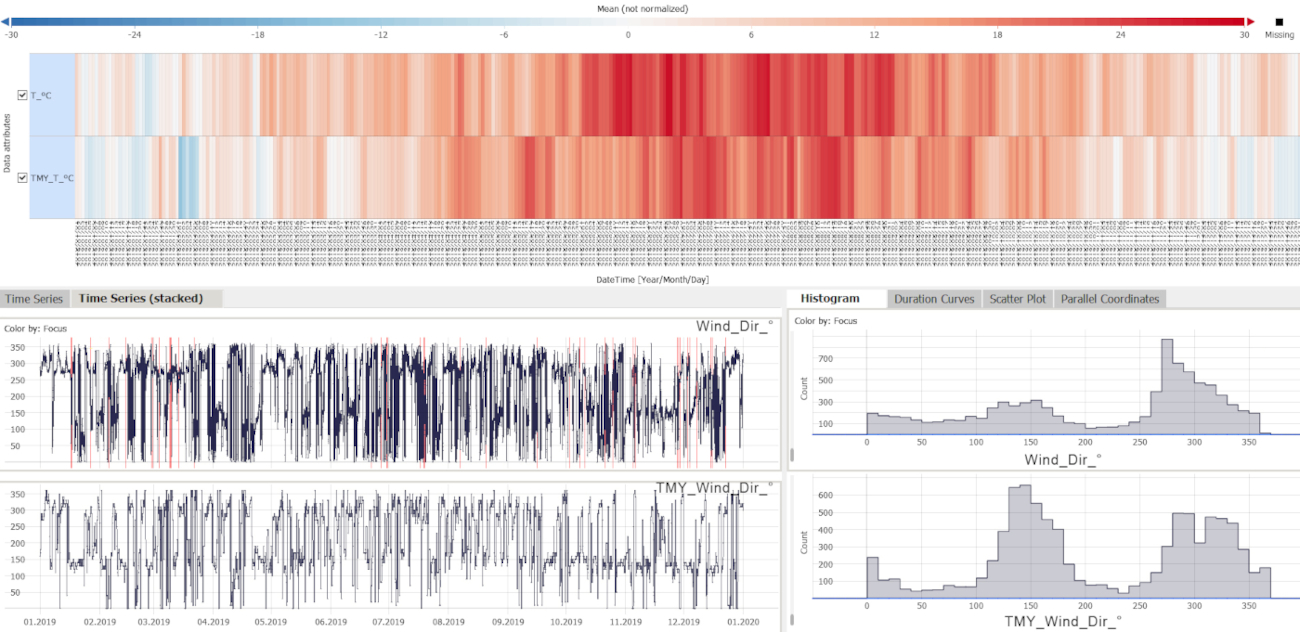
The role of visual analytics in the analysis of climate and weather data will be an even greater one in the future, as it is the only way to capture the complex interrelationships in their entirety and use them for better climate change adaptation solutions. VRVis has several experts specialized in climate and environmental data, for example working with Typical Meterological Year (TMY) time series or developing visual cockpits for biosolar technology performance assessment.

Blue-green infrastructure and Sponge City
Although climate change is a global problem, local measures in urban areas offer great potential for rapid relief. Innovative urban development which utilizies Sponge City concepts can not only tame the increasingly frequent and heavy rainwater, but also put it to productive use. Many municipalities rely on the strategic planning of blue-green infrastructure, such as green roofs or rainwater-fed biotopes. We create digital hydro-twins of cities and landscapes with our simulation and visualization application viscloud to solve real-world problems caused by too much water.
The ClimaSens project researches efficient and easy-to-access planning tools to enable engagement across different stakeholder groups in the shaping of climate-resilient habitats.

In a research project for Rhineland-Palatinate, VRVis is creating a cooperative digital hydro twin for the German federal state to support the development of protective measures against heavy rain and river flooding.

On the way to sustainable, climate-neutral cities, the EU project GREENGAGE is developing innovative technology solutions, for better population participation in the issues of mobility, air quality and healthy living.

For many years we have been dealing with all aspects of hydrodynamic modelling. With our software viscloud we can model different scenarios and also offer this as a service.