
Visualization of noise-simulation data
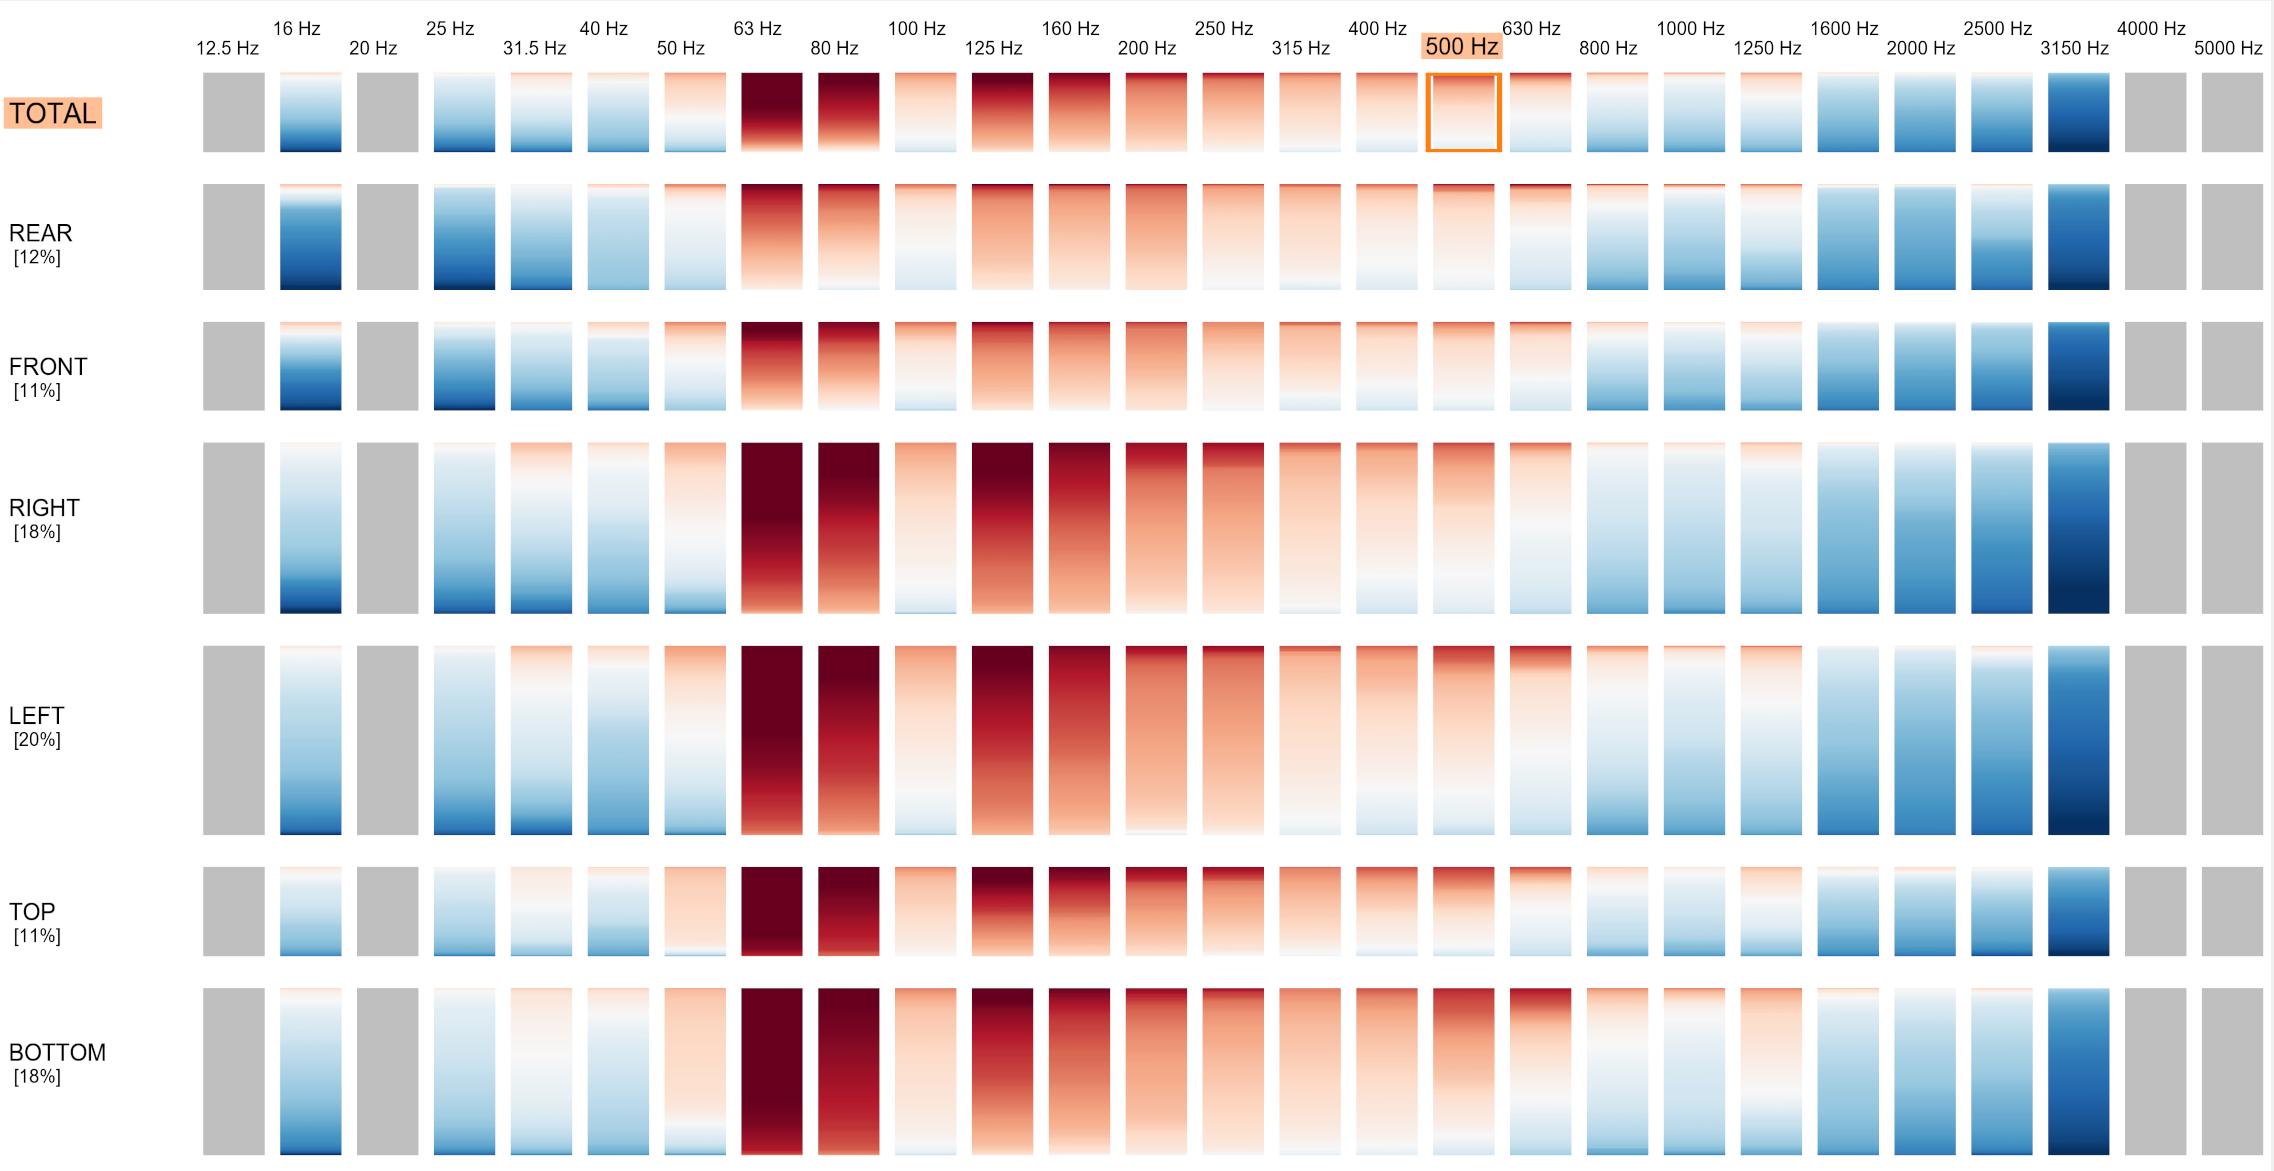
Due to increasingly stringent noise regulations and rising passenger comfort requirements, noise, vibration and harshness (NVH) simulation remains very important in the automotive industry. Early detection of problematic noise sources in the design and production process is crucial for reducing development costs and time-to-market of a product. Analyzing noise simulation data is challenging due to the data size and complexity. Working closely with our industry partners, we have developed a new, interactive approach to quickly identify and analyze critical noise sources. Complementing traditional analysis, the new approach provides additional insight into the data and facilitates understanding of the simulated phenomenon. Multiple carefully designed, interactive, linked views enable the investigation of noise, vibration, and harshness at multiple levels of detail, in both the frequency and spatial domains. Our research results have been published in several papers, for example "Comparative Visualization for Noise Simulation Data" (2023), "Interactive Visual Analysis of Structure-borne Noise Data" (2022), "Getting Insight into Noise, Vibration and Harshness Simulation Data" (2021).

Visualization for ergonomics: ErgoExplorer - interactive visual analysis of risk assessment data
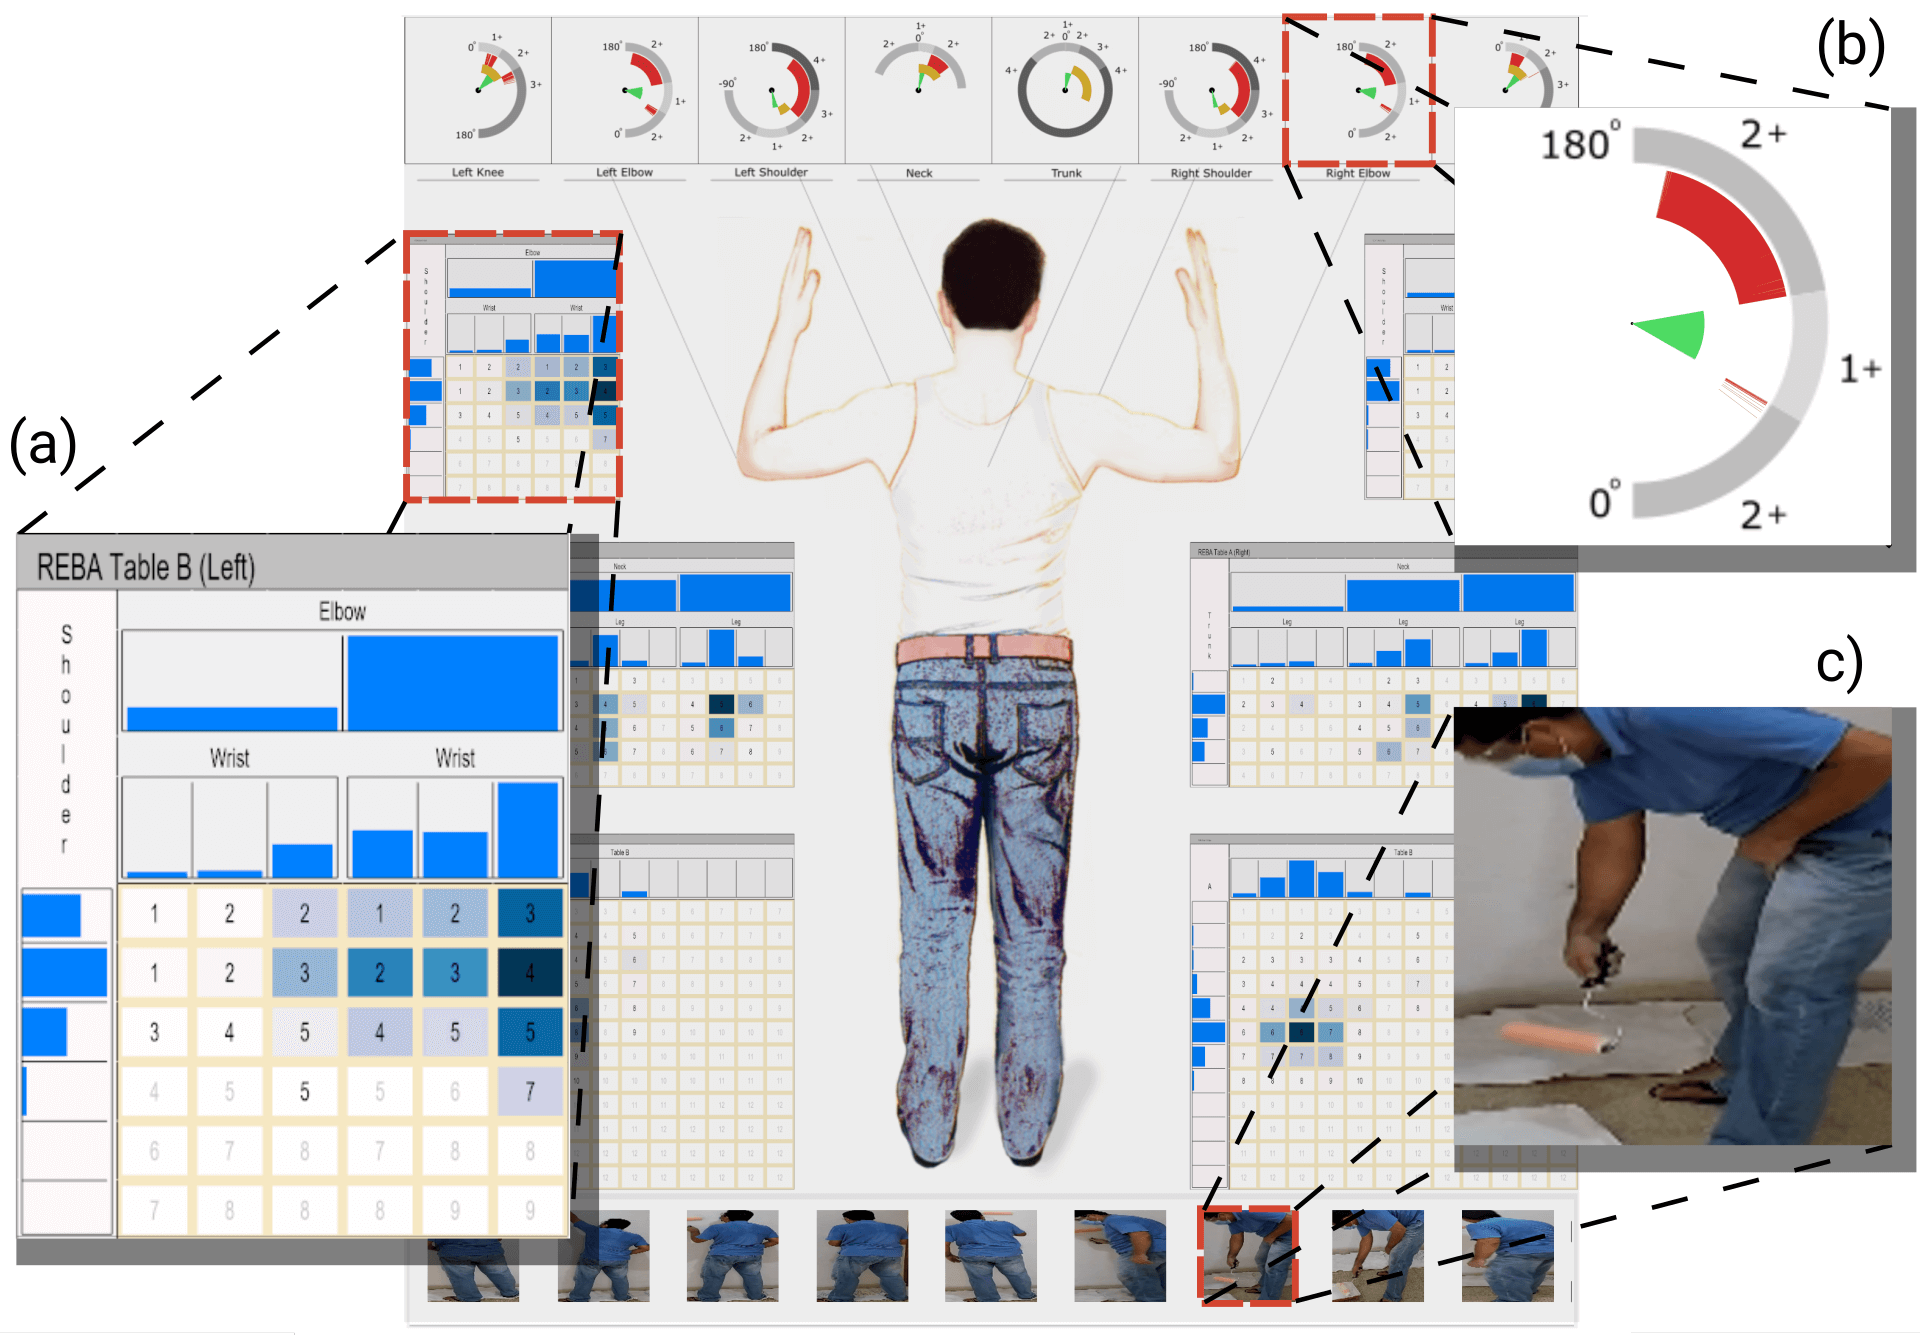
Ergonomic risk assessments are carried out more frequently today than in the past due to increased awareness. Traditional risk assessment, based on expert-assisted observation of workplaces and manual completion of score tables, is still predominant. Data analysis is typically done with a focus on critical moments, but without explicit support from contextual information and changes over time. In contrast to current practice, we focus on data spanning multiple actions and multiple workers, while preserving all contextual information. Data is automatically extracted from video streams and explored in an integrated interactive visual analysis system. The newly introduced approach supports analysis and exploration at several levels of detail, ranging from a general overview, down to inspecting individual frames in the video stream, if necessary. The first results have been published in IEEE Transactions on Visualization and Computer Graphics, and have been presented at IEEE VIS 2023, the premium visualization research conference. More details can be found on the project website.

Visualization of complex urban data
The increasing availability of official data of cities, as well as the development of open data and citizen science movements, require efficient analysis solutions to enable all interested stakeholders to extract useful information from the vast amounts of urban data. Interactive visualization has emerged as an indispensable complement to automated analysis of complex spatio-temporal data.
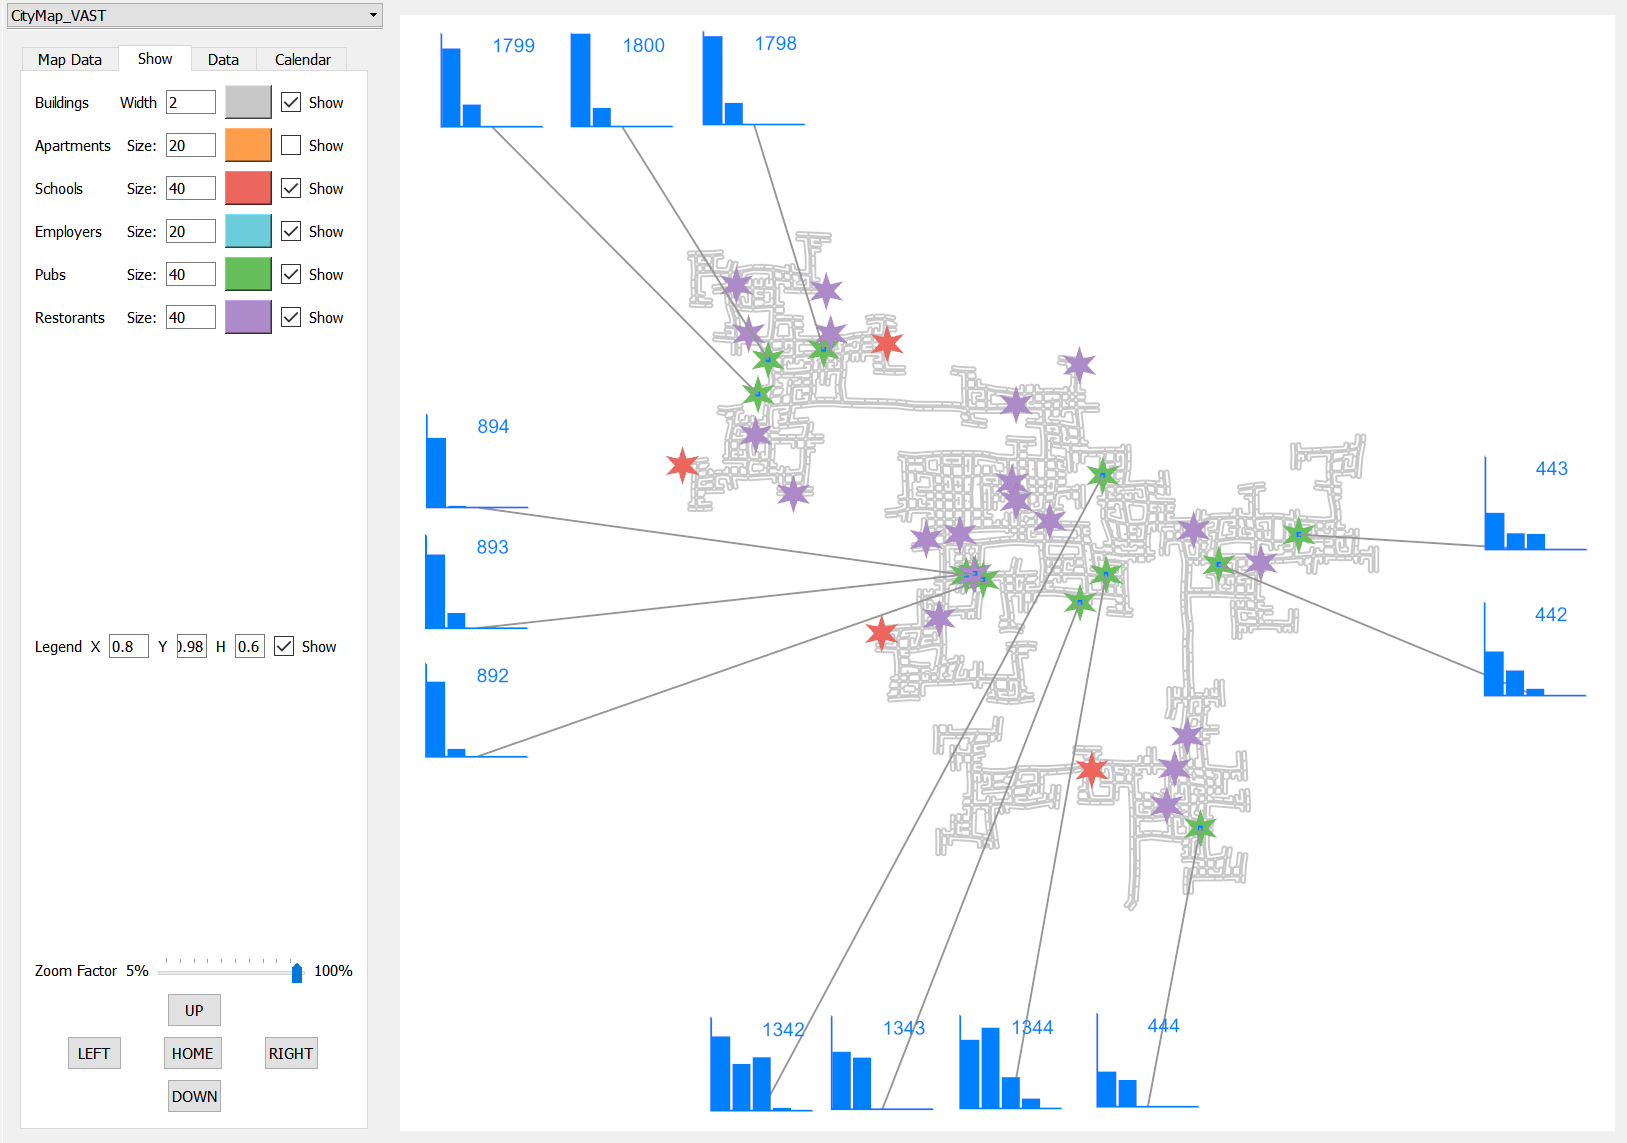
The IEEE VAST Challenge 2022 provides complex urban data that spans a 15-month period and includes citizen traces, various citizen data (income, purchases, restaurant visits, etc.), and data on businesses operating in the city. We used ComVis, our coordinated multiple views solution, to explore and analyze the data, with a particular focus on the urban economy. Our solution received an honorable mention at the IEEE VIS 2022 conference for its clear articulation of hypotheses and metrics. The same data set also provides the basis for our publication "Interactive Exploration of Complex Heterogeneous Data: A Use Case on Understanding City Economics" (2023).

Geotunnel Viewer - interactive monitoring systems for tunneling
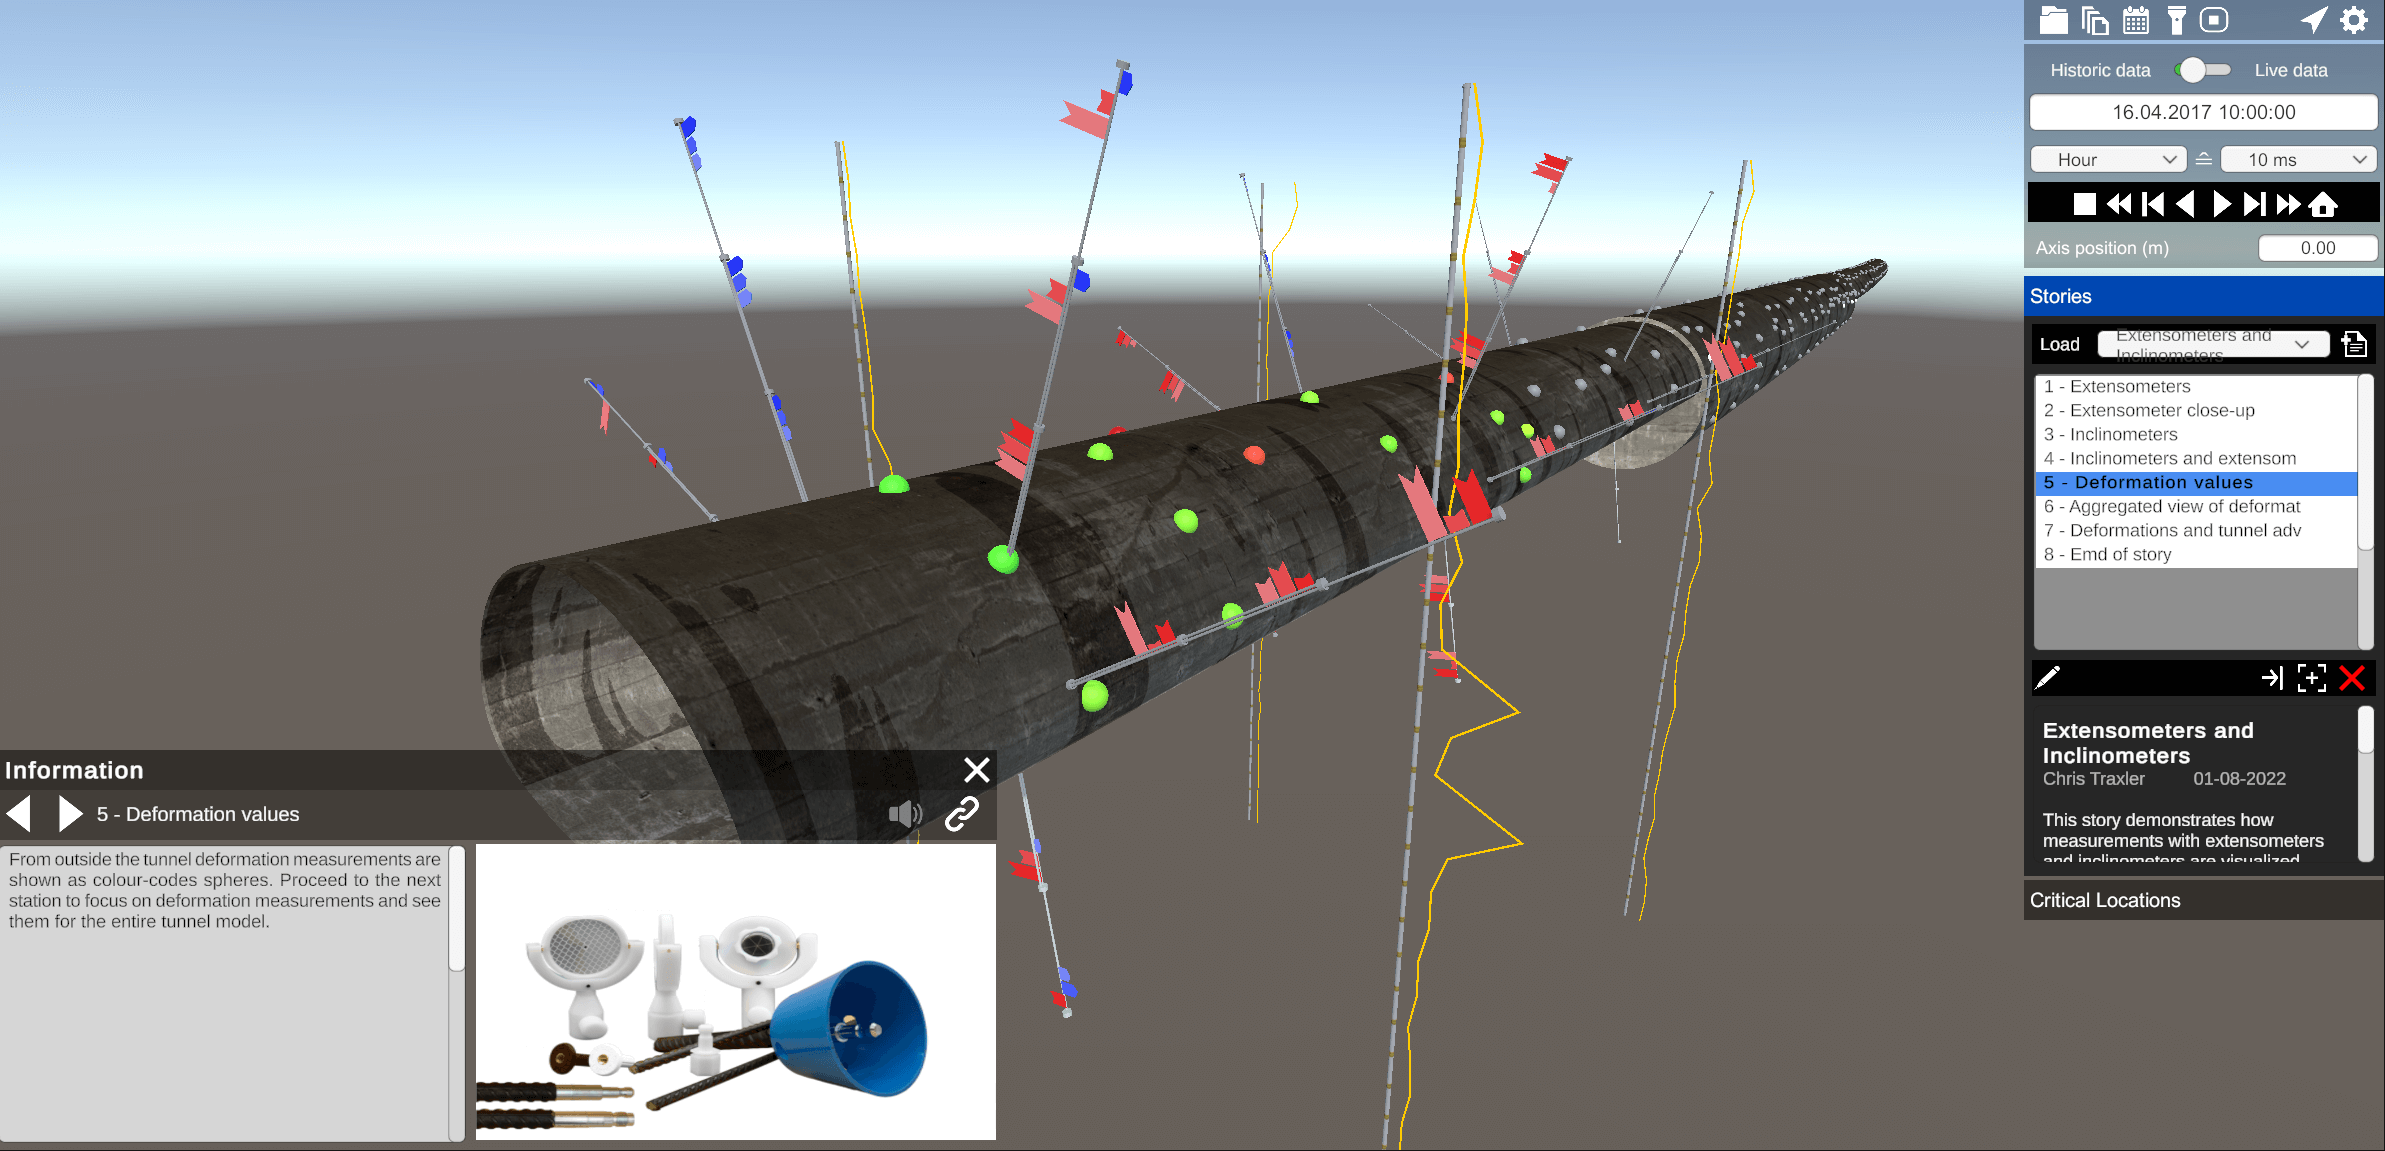
Tunnel monitoring is an integral part of construction and for the safety of operation. It is based on regular measurements of the forces acting in the surrounding rock and tunnel wall deformations caused by them. For that, various sensors are placed along the path of a tunnel. The Geotunnel Viewer is an interactive tunnel monitoring tool based on digital twins of tunnels as key elements, which are enhanced by geospatially anchored sensors. Animated visualizations show the progress of the construction and its effect on sensor values. Recently we embedded a storytelling mechanism that supports collaboration among remotely located analysts (e.g., geotechnical experts). It makes observations based on complex heterogeneous sensor data in its spatiotemporal context more understandable and reproducible. Storytelling is also a very effective way to train apprentices.

Pests and extreme weather affect grain growth and yields. Recording and analysing plant development provides the basis for the prevention of crop losses. VRVis is part of a project consortium developing a platform for agriculture with the aim of using functional imaging data for analysis and teaching skills in training courses.

The ClimaSens project researches efficient and easy-to-access planning tools to enable engagement across different stakeholder groups in the shaping of climate-resilient habitats.

Construction sites are highly dynamic places, which makes complete and convenient documentation all the more important. As part of the "AI5production" program, VRVis and rmDATA are investigating whether mobile devices with LiDAR and high-resolution cameras are suitable for automatically recording construction processes in 3D.

In a research project for Rhineland-Palatinate, VRVis is creating a cooperative digital hydro twin for the German federal state to support the development of protective measures against heavy rain and river flooding.

The cities of the future rely on blue-green infrastructure: the University of Copenhagen, Henning Larsen and VRVis develop a software framework that combines hydrological modeling and 3D visualization for sponge city planning.

Digitization of construction sites: VRVis and clone:it automate rebar inspection and documentation.

In construction projects, 2D plans, 3D plans, reconstructions or real world data run in parallel without being linked to each other. VRVis and PlanRadar are now bridging this gap with a mobile AR tracking solution, the Onsite-AR project.

VRVis developed a virtual environment that enables hazard-free training of safe ammunition storage for the Austrian Armed Forces Logistics School.

In this WWTF-funded project, VRVis is developing a roadmap that will serve as the basis for positioning visual computing as a key enabling technology for the real-world implementation of digital humanism.

On the way to sustainable, climate-neutral cities, the EU project GREENGAGE is developing innovative technology solutions, for better population participation in the issues of mobility, air quality and healthy living.

Automatic creation of visualization models in VR through interface from GIS to XR enables faster mission planning.

InPlan and VRVis develop a visualization and simulation package for energy planning of buildings, which enables intuitive optimization in terms of energy efficiency and comfort.

In the PROVEX project, JOANNEUM Research and VRVis are developing a provenance-aware workflow management tool for heterogeneous data for use in ESA's HERA mission.

PanCam-3D focuses on the further development of interactive 3D visualizations for the ExoMars 2022 mission.

The Rail4Future project is focusing on the design of a digital rail system for the future. To this end, a novel and fully virtual validation platform for large-scale simulations of entire rail lines is being developed to increase the efficiency of existing rail infrastructure.

The aim of the project IVC Stream is to research novel visual computing solutions for simulation and measurement data.

The strategic project of the area is the organizational and scientific hub for the realization of the area-wide intelligent visual computing approach for analytics and modelling based on ensembles of dense grid-based data, derived data, and digital embedding.

The research goal of AMASE is to create a suite of tools and methods to ingest, process, visualize, and manipulate heterogeneous, large-scale geospatial data. This data is the constantly updated representation of the real world in the form of an evolving digital twin.

The main goal of this project is to enable a reliable decision support for large-scale infrastructure projects by providing solutions for a collaborative visual analysis of digital twins.

The main objective of the strategic project ARCS is the design of software architectures that enable interactive visualization systems to ingest large volumes and velocities of geospatial and associated non-geometric data.

The goal of the project MARAMT is to develop a software framework to significantly reduce the effort required to work with existing and future complex cyber-physical systems.

Within the project Larvalbrain 2.0, a dynamic multi-scale multi-level atlas and data collection of structural, molecular, physiological, and behavioral results of Drosophila melanogaster larvae will be established.

Visual Analysis of Asteroid Deflection.

For many years we have been dealing with all aspects of hydrodynamic modelling. With our software viscloud we can model different scenarios and also offer this as a service.

We create a digital twin of a community and simulate weather events to identify high-risk buildings and infrastructure vulnerabilities.

Understanding how the brain works is one of the biggest challenges addressed by neuroscientists today. Modern neuroscience research is extremely data-intensive and requires special software infrastructures to enable and accelerate the discovery of the complex interplay of genes, structure and function.

Training AI algorithms requires a great amount of data. However, raw data often contains sensitive information. Homomorphic encryption offers a solution for secure machine learning - with protected sensitive data.

VR and AR provide new solutions for the automotive industry, especially in the prototyping phase: Perfect digital VR twins can be used to easily check how new designs or adaptations affect the prototype.

The goal of HORA 3D is the development and maintenance of a publicly accessible web application for object-related visualization of the results of the HORA 3 research project.

viscloud's hydrodynamic simulations provide precise water level predictions at any point on a water surface in the "PegelAlarm" app.

New technologies and security policy developments bring a paradigm shift for the Austrian armed forces. The use of information and communication measures entails both challenges and opportunities: for combat, security and rescue manoeuvres.

The goal of the applied research project En2VA (“Visual Analytics for Energy and Engineering Applications”) is to increase the efficiency and the quality of advanced analytics for high-dimensional data from manufacturing, engineering, and the energy sector.

Together with Rhomberg Bau GmbH and convex ZT GmbH, VRVis is developing a concept for the use of Boston Dynamic's robot dog "Spot" for autonomous, immersive construction site documentation.

WIBSTAC addresses the usage of wide baseline stereo 3D reconstruction for medium- and long-range mapping of the Martian surface, based on imagery from panoramic rover camera instruments.

The INDIGO research team is systematically documenting the graffiti on Vienna's Donaukanal, using these photos to create a digital twin of the walls. VRVis is currently contributing its technological expertise to the project.

No blind spots on train roofs thanks to depth cameras.

The applied research project Lightbox 2.0 focuses on the development of a photogrammetric 3D scanner for automatic and deep learning-based modeling of all kinds of keys.

Support for planetary research: Visual analysis of reconstructions of the Mars surface and view planning for rover camera instruments.

Virtual exploration and geological analysis of reconstructed Mars surfaces and rock outcrops.

Visual computing for medicine: image processing solutions for new applications in radiology.

ARCHES - Accessible Resources for Cultural Heritage EcoSystems was an EU-funded Horizon2020 project coordinated by VRVis.

To take full advantage of data from automotive simulations and measurements, we combine interactive and automatic Visual Computing methods to find intuitive, efficient and effective solutions that are applicable in the daily routine of engineers.

In this project tools and methods for handling, administration, manipulation and evaluation of several different data sources for measurements and lighting design are developed.

Research project on powerful visualization methods to support decision making in complex infrastructure projects, especially in tunnel, railway and road construction.

MINERVA is an integrated framework for planetary scientists allowing members of different instrument teams to cooperate synergistically in virtual workspaces by sharing observations, analyses and annotations of heterogonous mission data.

Visualization and visual analysis of high-resolution surface reconstructions find a wide range of applications, from tunnel monitoring and archaeological excavations to the change management of cultural heritage buildings.

The long-term vision of this applied research project is to use available data resources to improve image-based diagnostics based on complex data in daily clinical routine.

The combination of "liquid biopsies", machine learning and data visualization aims to enable earlier and more accurate prediction of a relapse in children with cancer.

The strategic project forms the organizational and scientific hub for the realization of an area wide integrative visual computing approach. It covers joint strategic research and development on fundamental challenges in all application projects.

Complex simulation data is practically omnipresent today.

Practical flood management with decision software viscloud.

Digital representations of the real world and digital twins are becoming increasingly important for planning, situation assessment and decision-making.

The HORA 3 project focuses on flood modelling for all rivers and streams in Austria. The results are detailed flood risk maps for different annual periods.

Barrier-free access to art and museums for blind and visually impaired people through 3D technology.

With Augmented Reality, simulation results of car engine noises become visible.

For centuries, neuroscientists have been mapping the brain. Until now, the step from simple maps to a generally accepted model has proved to be extremely difficult. In this project, a 4D atlas of the brain of the fruit fly larva is being built.

A visual tool for a combined stratigraphic and temporal documentation and interpretation of excavation projects.

Novel visual analysis technologies for high-dimensional data in automotive engineering, industrial manufacturing and the energy sector

A more efficient way to create operating manuals from existing databases for product life cycle management using Augmented Reality.

Decision support system for floods and inundations for the trading district of Shenzen, China.

With the KAUST Scene Generator three-dimensional road networks can be generated from open-source OpenStreetMap data.

Strategic Research in Scalable, Semantic Rendering.

Localization of Virtual Sound Sources: Effects of Pointing Method, Visual Environment, and Training.

Flood protection through simulation and visualization: Reducing the effects of floods and communicating measures to the public.

Planetary Robotics Vision Data Exploitation.

Investigation of techniques enabling a seamless analysis of data from multi-run simulations on multiple degrees of detail.

Seamless visual analysis of data involving 3D geometry, relational information and multivariate attributes.

Research and development of novel interactive visualization methods for visualization and understanding of complex systems.

In order to preserve the architectural heritage, we use methods of photogrammetry, thermography, photometry as well as laser scans to carry out inventories, recognition and documentation of changes in protected buildings.

Algorithms to improve the visual analysis of surface reconstructions.

VRVis contributes data analytics and visualization tools tailored to support and accelerate research of the Haubensak Group at the Institute of Molecular Pathology Vienna.

High-quality lighting simulation requires dynamic, interactive, realistic real-time lighting simulation for various complex architectural environments.

Visual computing techniques for the automated detection of osteoporosis and osteoarthritis.

Software for the use of multi-modality images in external radiotherapy.

Visual Analytics for Modeling and Simulation: Improvement of simulation setup and design scenarios with tools and methods of Visual Analytics.

Improving and combining multiple sensors to increase the accuracy and reliability of modern surveying equipment.

Decision support systems and 3D viewing technologies for tunnel construction.

Next generation workflows for interactive knowledge generation from images and simulations.

The analysis, visualization and exploration of high-dimensional image spaces are the subject of the KAFus project.