

With its Industry 5.0 concept (Industry 5.0 - Towards a sustainable, human-centric and resilient European industry), the European Union is committed to a new industrial revolution that goes beyond purely technical and economic goals. The focus is on people: the employees involved in the production as well as the end users. The Industry 5.0 concept thus puts human-centric technologies and solutions at the center. Likewise, the focus is on sustainable practices and resilient structures. VRVis is a project partner of the European Digital Innovation Hub AI5production, an alliance of established research and technology institutions to support domestic industry and business on their path to digital transformation through human-centric artificial intelligence solutions and related technologies.
At VRVis, we develop solutions for our partners that use state-of-the-art data science and visual analytics approaches to improve and even shorten data analysis processes. As a result, our solutions for a better understanding of production processes have already reduced the analysis time of an entire working day to just five minutes - and this for process experts without data science experience with a data volume of several years' worth of data. We also use the latest artificial intelligence approaches to automate production processes. With our research, we support the entire development cycle from data quality analysis, annotation of training data and AI-based modeling to the development of tailored solutions, e.g. for quality assurance in production or image-based analysis of materials.

All the data that accumulates in Industry 4.0 is important information that, when correctly prepared, not only improves the explanation of existing processes, but above all enables forecasts for the future. Visual Analytics offers a range of presentation options here, above all predictive modelling, which can predict future results based on real data. Here it is essential to always focus on evaluating the quality of the data because models can only be as good as the data on which they are based.

The digital twin and its fields of application are among the most important topics in Industry 4.0, where companies are facing major challenges due to the digital transformation. As a digital copy of a real object or as a model of something that will be created in the future, the digital twin makes it possible to run through production processes from the initial idea to production and to simulate a wide variety of scenarios in a very short time. The preparation and accompaniment of real production processes by digital twins not only saves costs and resources but also allows a better understanding of the data and thus, for example, more accurate predictions in a production plant.

Immersive technologies provide meaningful solutions for handling the large volumes of data that are routinely generated in Industry 4.0. With the help of extended reality (XR), even big data can be made accessible to people in a way that is easy to understand and low-threshold: for example, by processing huge data volumes in virtual reality. In this way, the user can, literally speaking, stick his head into his 3D data.
Extended Reality applications in the area of training and education, which are increasingly used in Industry 4.0 in planning, control and production, function in a comparable way. Virtual reality training courses offer employees highly realistic environments and experiences in which they can immerse themselves "as if in real life" and thus have a lasting, authentic learning effect. VR training is particularly suitable for complex or even high-risk training, e.g., in the area of fire protection.

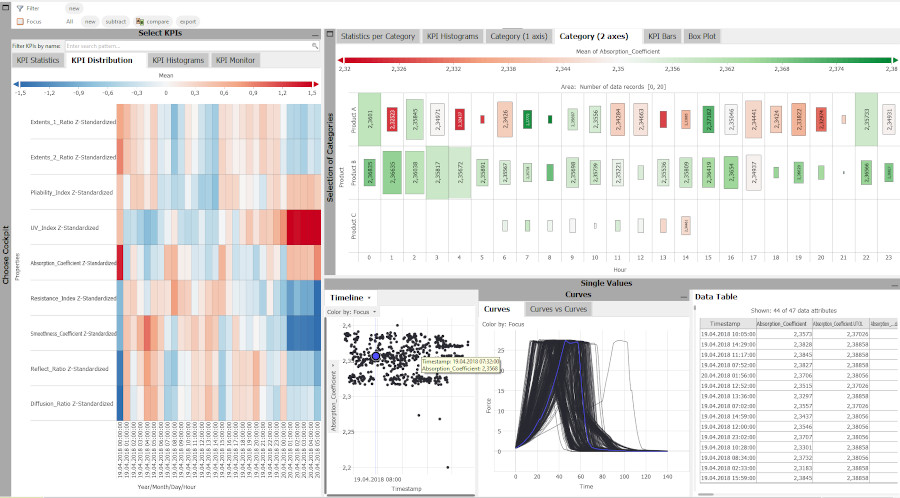
The interactive visual analysis of complex as well as large parameter data sets is essential for many industries, especially in connection with simulation ensembles or prototype development. At VRVis, we have been developing various methods and tools for over 15 years to be able to interactively analyze and optimize large simulation data from various fields "on the fly".
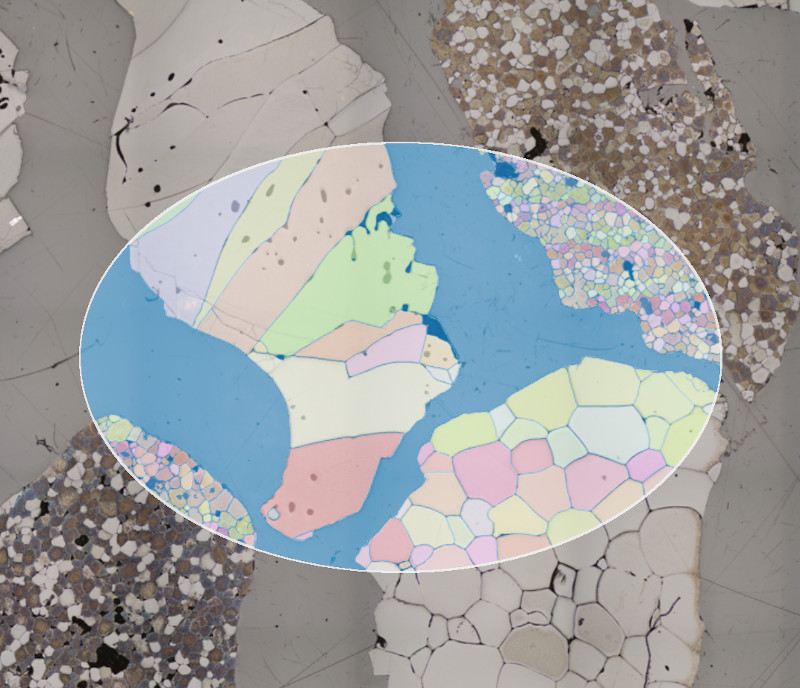
Visual computing and artificial intelligence are two key technologies in the realization of Industry 4.0, on which our partners like RHI Magnesita rely. In cooperation with this partner, we research the latest approaches of artificial intelligence in order to advance image-based defect and anomaly detection in the production of refractory materials. With our research, we support the entire development cycle from harmonization and annotation of data to fully automated defect analysis.

Digitization solutions along the entire chain of value creation - from planning and production to assembly and documentation - are of great importance for today's construction industry. Especially on a construction site, many work processes happen simultaneously, making documentation often very challenging. VRVis uses robot dogs specifically adapted for use in the construction industry to enable the fully autonomous creation of digital and immersive construction site clones.

VRVis is supporting Hage Sondermaschinenbau with its expertise in machine learning: Hage needs a monitoring system for spacious facilities to ensure that no people are within the machines' activity range. Thus, VRVis is testing the suitability of ML methods for safety in industrial environments.
Regular maintenance of the vehicles is necessary for safety in rail transport. When working on the train roof, technical personal might forget spare parts or tools. This can be dangerous when going at high speed. VRVis and Zugkraft-kN are designing a scanner for train roofs, automatically detecting this problem.
The HEROD project employs a combination of sensor technologies, data analytics, ontologies, and visual computing to improve predictability and quality assurance in 3D printing.
In the European Digital Innovation Hub "AI5production", 17 renowned scientific institutions have joined forces to support manufacturing companies on their digitalization journey with the help of AI technologies.
The project REINFORCE researches how reinforcement learning and human-centered visualization methods can be used to solve complex control problems in an efficient, fast, and flexible way.
This project aims at accelerating and automating image-based decision making with an application focus on medicine, recycling and quality assurance processes in manufacturing.
The primary goal of project INGRESS is to accelerate and improve the process of data scientists working with Industry 4.0 and Internet of Things (IoT) data, by enabling a closer integration of visual analysis into the existing workflows.
The RAILING project deals with the research and development of interactive, scalable and trust-building visualization and analysis tools for the exploration of time-dependent and complex data.
The goal of the project MARAMT is to develop a software framework to significantly reduce the effort required to work with existing and future complex cyber-physical systems.
Training AI algorithms requires a great amount of data. However, raw data often contains sensitive information. Homomorphic encryption offers a solution for secure machine learning - with protected sensitive data.
An augmented reality solution for optimizing process development in laboratories and monitoring ongoing experiments supports pharmaceutical research.
New technologies and security policy developments bring a paradigm shift for the Austrian armed forces. The use of information and communication measures entails both challenges and opportunities: for combat, security and rescue manoeuvres.
The goal of the applied research project En2VA (“Visual Analytics for Energy and Engineering Applications”) is to increase the efficiency and the quality of advanced analytics for high-dimensional data from manufacturing, engineering, and the energy sector.
No blind spots on train roofs thanks to depth cameras.
Fire training for non-professionals is expensive, complicated and dangerous. The solution: a simulation in a virtual environment.
This project is dedicated to training and workflows in Mixed Reality.
In this project we develop new methods from the field of visual analysis and machine learning to automate the quality control and quality assurance of glass articles.
In this project tools and methods for handling, administration, manipulation and evaluation of several different data sources for measurements and lighting design are developed.
With Augmented Reality, simulation results of car engine noises become visible.
A more efficient way to create operating manuals from existing databases for product life cycle management using Augmented Reality.
Strategic Research in Scalable, Semantic Rendering.
Investigation of techniques enabling a seamless analysis of data from multi-run simulations on multiple degrees of detail.
Research and development of novel interactive visualization methods for visualization and understanding of complex systems.
Visual Analytics for Modeling and Simulation: Improvement of simulation setup and design scenarios with tools and methods of Visual Analytics.
Improving and combining multiple sensors to increase the accuracy and reliability of modern surveying equipment.
Decision support systems and 3D viewing technologies for tunnel construction.
Next generation workflows for interactive knowledge generation from images and simulations.