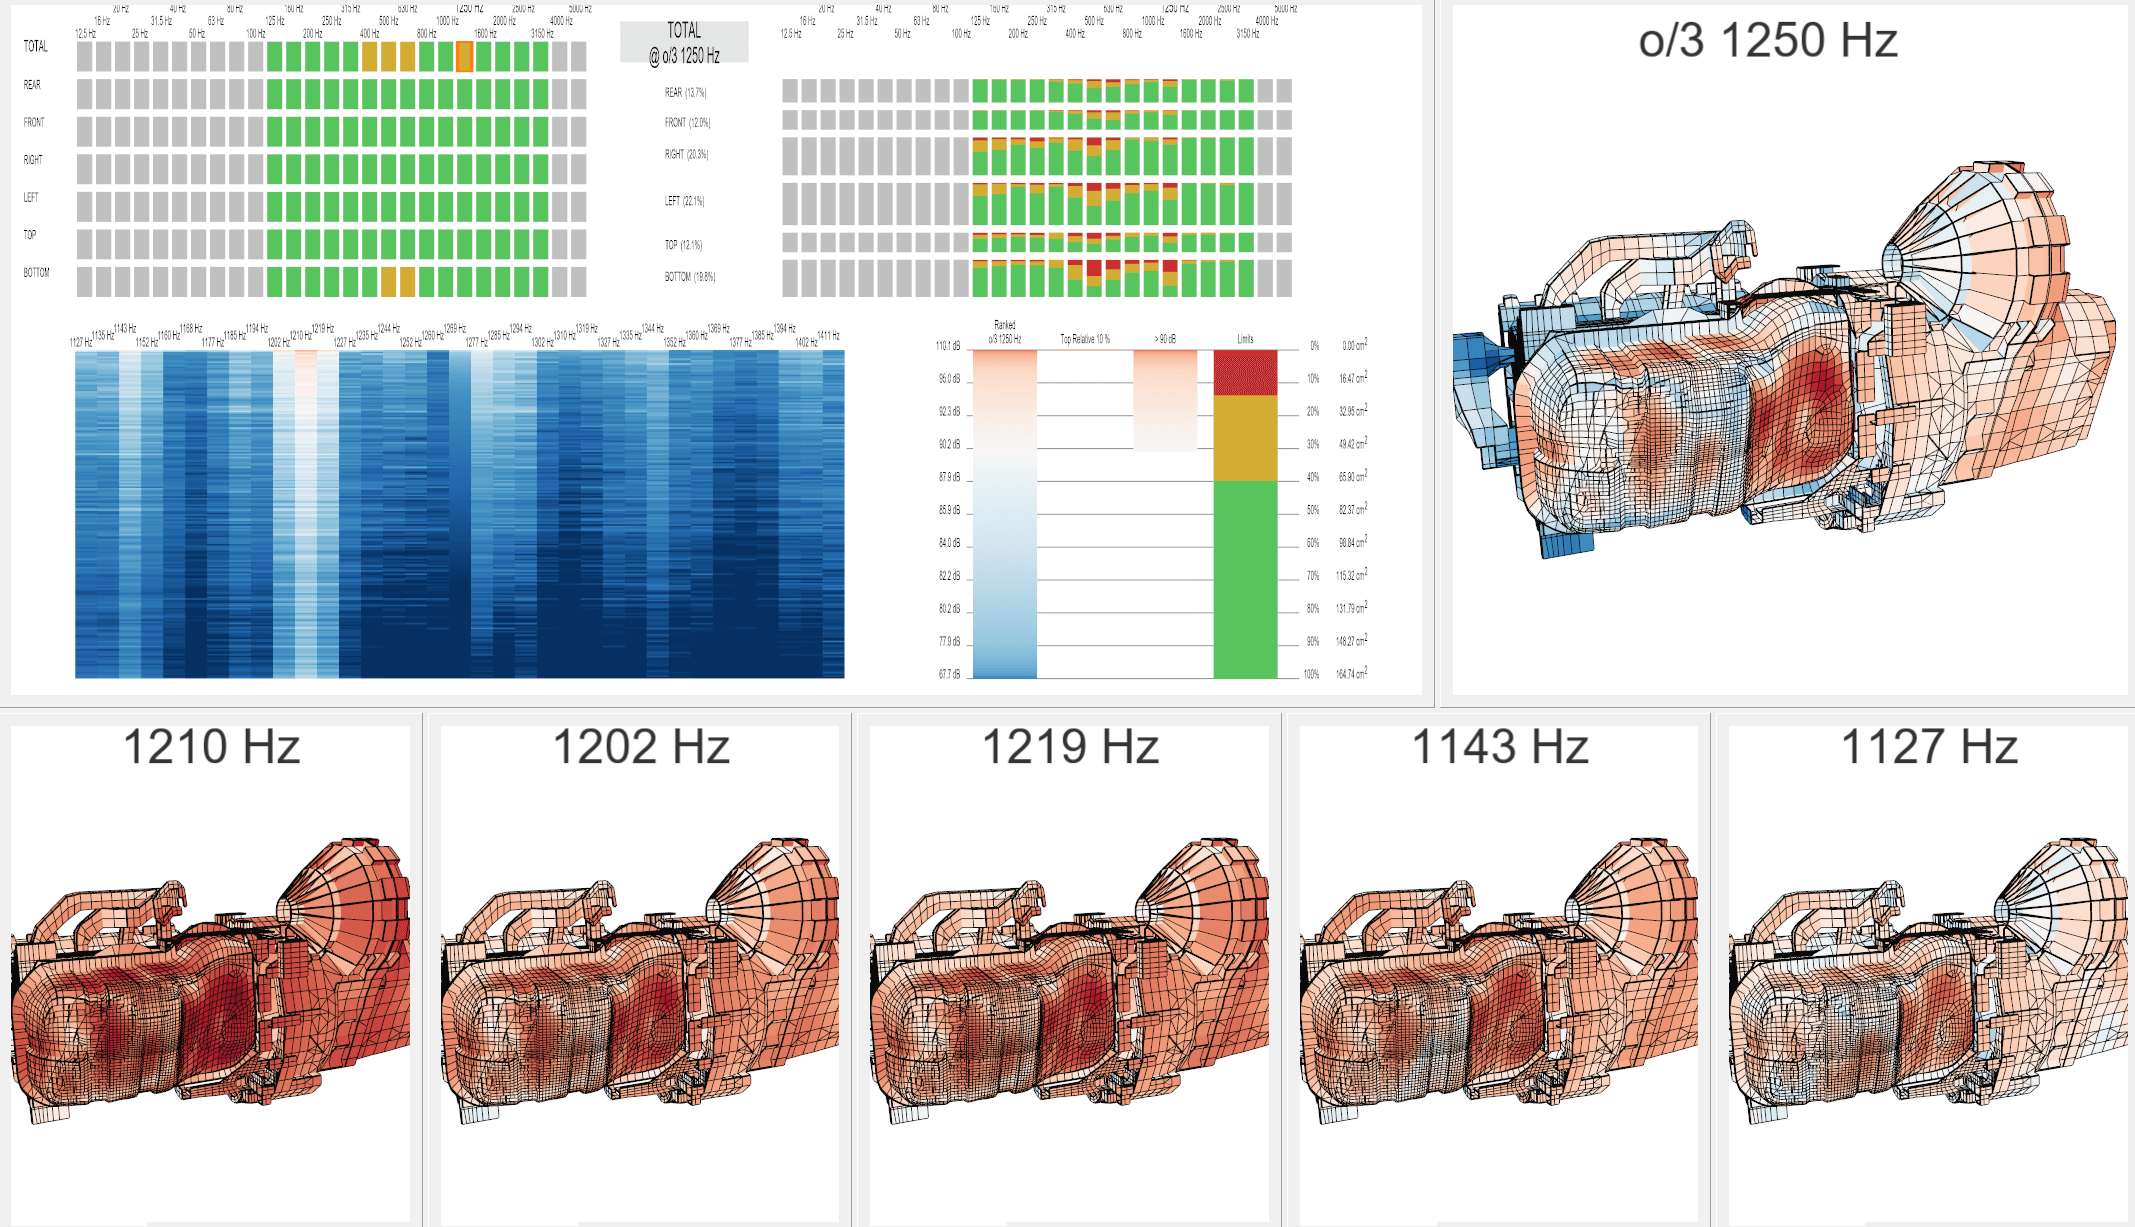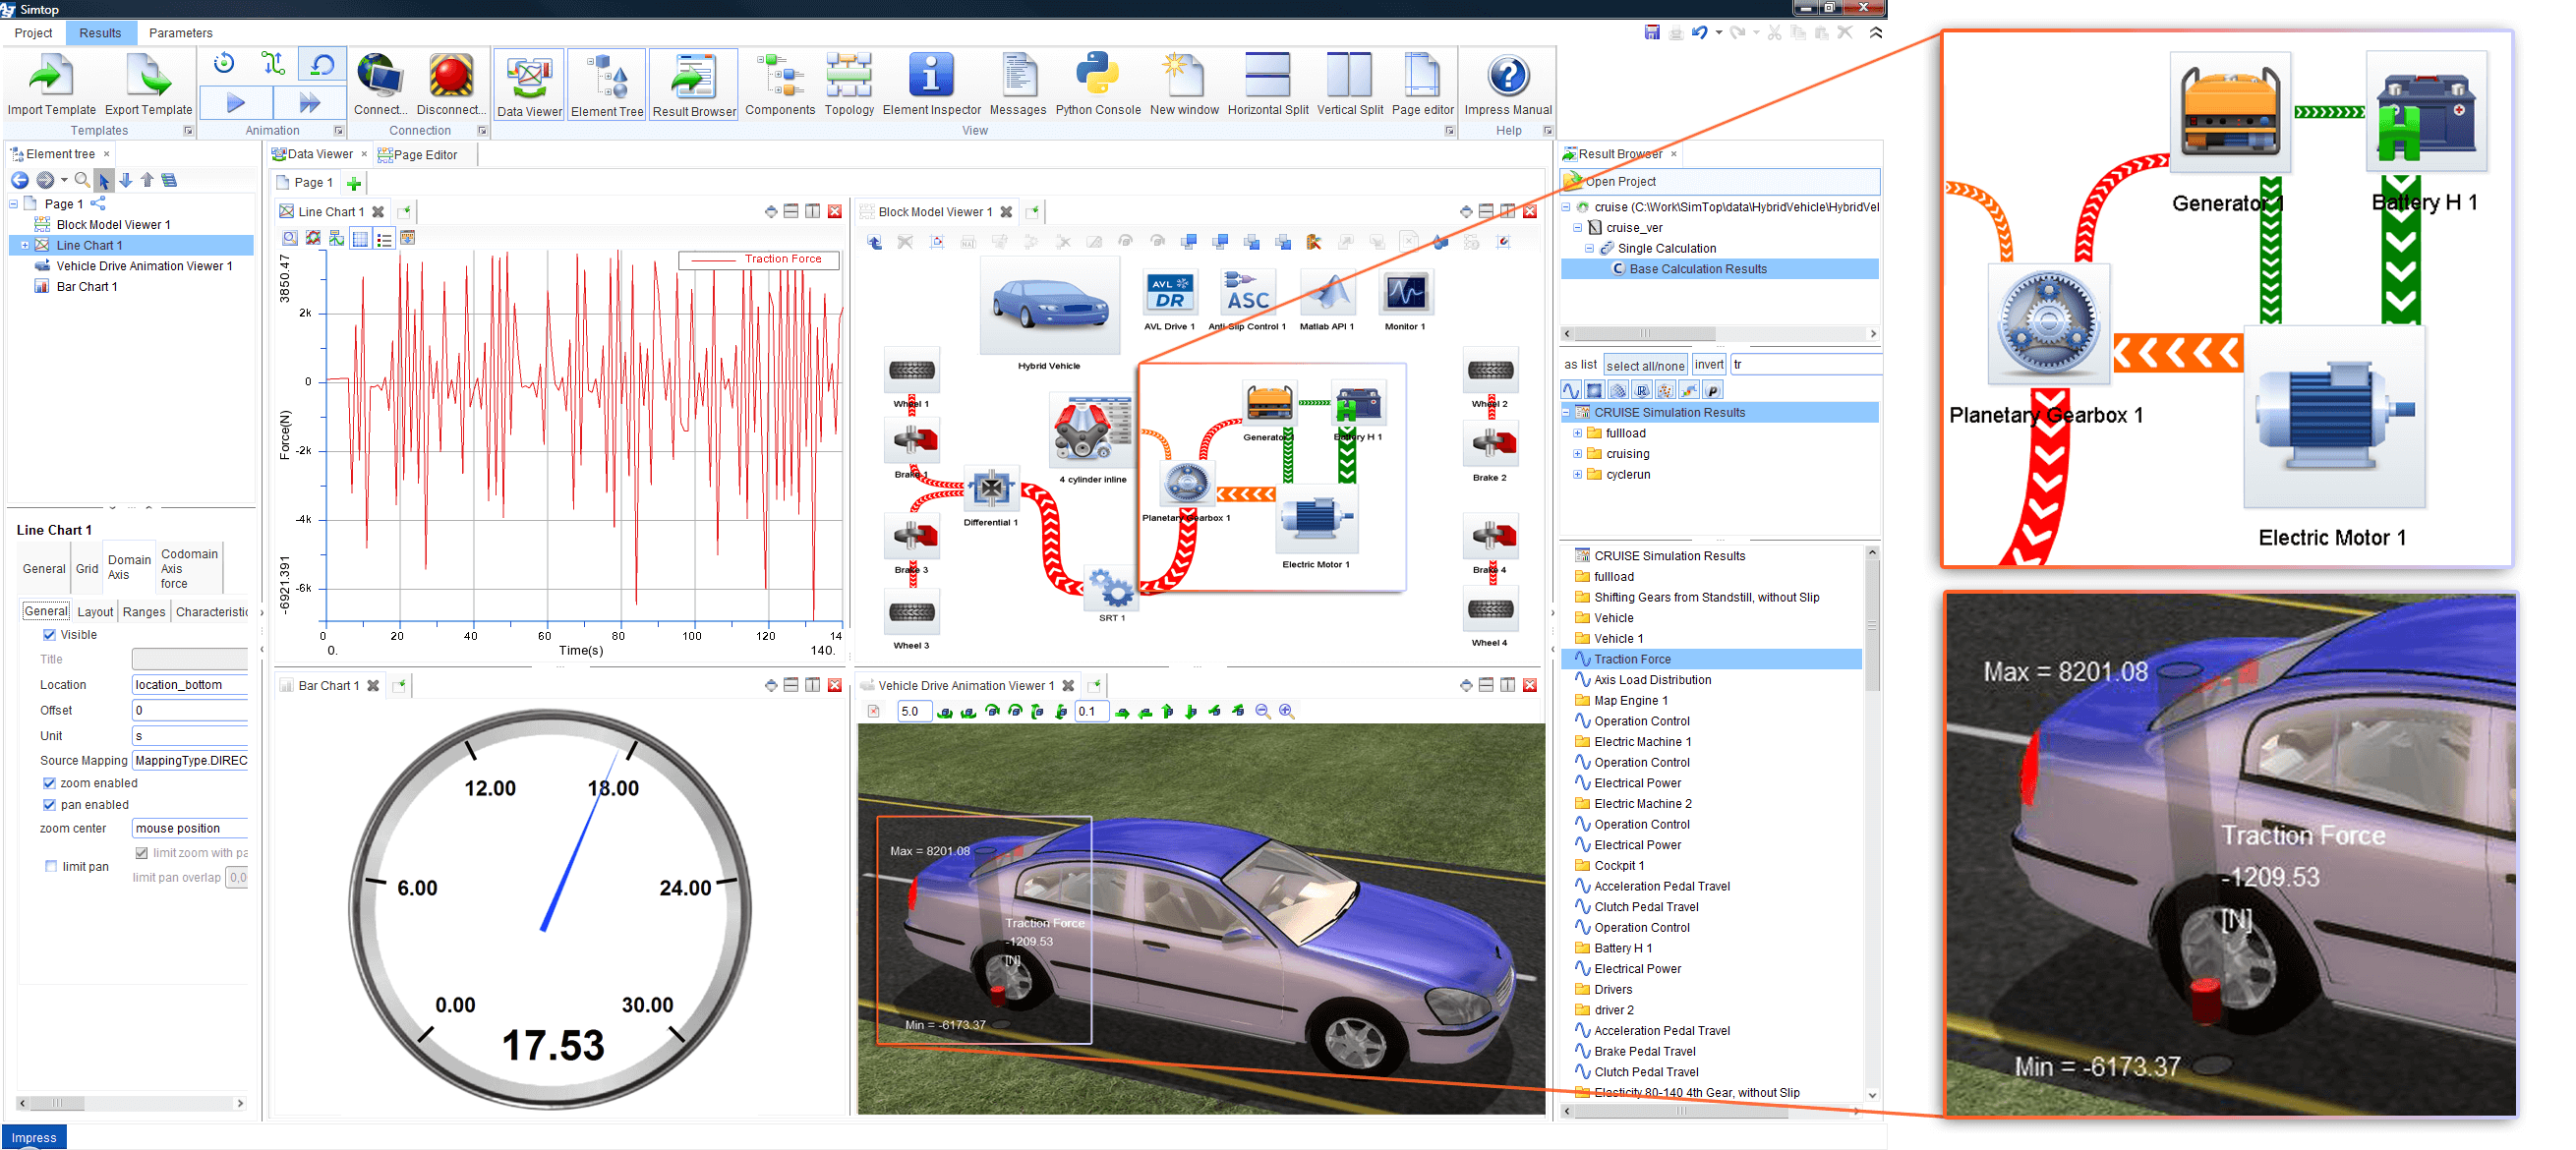

To extract the right information from simulations, it is of utmost importance to visualize the simulation results in a correct and comprehensible way. We have been developing efficient applications and solutions for this purpose for many years - especially for the automotive industry. The spectrum here ranges from our software products ParaView and SimVis to our systems for 3D simulation data or the combination of 2D and 3D visualizations of heterogeneous simulation results from several solvers as well as to solutions for the online monitoring of real-time simulations and much more. Thanks to modular approaches, we can combine our visualization solutions with different solvers and preprocessing tools easily, allowing for adjustments in simulation runs.

We recognized the great importance of simulation ensembles early on, especially in connection with the development of prototypes. Therefore, we have been developing various methods for interactive visual analysis of complex and large parameter data sets for the past 15 years. In addition to advanced solutions that help to analyze and optimize complex ensembles from different areas of automotive production, we are researching new "on the fly" control methods for ensemble simulations based on automatic optimization techniques. In addition, we are working on new interaction mechanisms that improve the efficiency and accuracy of analysis.
![VRVis creates VR solutions for sustainable engine development [Translate to English:] Screenshot of a VR environment with the lettering AVL in the background and a green-blue-red-yellow colored 3D engine model in the foreground.](/fileadmin/02_Technologie_und_Anwendungen/Loesungen/Automobilindustrie/image2019-1-11_15-30-19.png)
The development of non-conventional interface solutions is one of our main concerns to ensure the best user interfaces and most efficient workflows for automotive engineers in the future. For example, we are researching how so-called "tangible brushing" can be applied in automotive development: The main idea here is the use of real objects, in our case physical maps, for collaborative specification and formulation of a planned model. Furthermore, we also explore ways in which XR technology can be used to communicate simulation results.

The aim of the application project IVC Multi is to research novel intelligent visual computing methods supporting decision-making in automotive industry, medicine, and life sciences based on ensembles of heterogeneous, multi-scale and/or multi-temporal data.

The aim of the project IVC Stream is to research novel visual computing solutions for simulation and measurement data.

The goal of the project MARAMT is to develop a software framework to significantly reduce the effort required to work with existing and future complex cyber-physical systems.

VR and AR provide new solutions for the automotive industry, especially in the prototyping phase: Perfect digital VR twins can be used to easily check how new designs or adaptations affect the prototype.

The goal of the applied research project En2VA (“Visual Analytics for Energy and Engineering Applications”) is to increase the efficiency and the quality of advanced analytics for high-dimensional data from manufacturing, engineering, and the energy sector.

To take full advantage of data from automotive simulations and measurements, we combine interactive and automatic Visual Computing methods to find intuitive, efficient and effective solutions that are applicable in the daily routine of engineers.

Complex simulation data is practically omnipresent today.

With Augmented Reality, simulation results of car engine noises become visible.

With the KAUST Scene Generator three-dimensional road networks can be generated from open-source OpenStreetMap data.

Research and development of novel interactive visualization methods for visualization and understanding of complex systems.