

Visual analytics creates visual solutions for data-based questions that still very much involve humans in the decision-making process. At VRVis, we are concerned with how we can best visually represent very large data in order to make it analyzable and easily usable by humans. This is of enormous relevance for many research and application fields, which is why our research work is so broad: We are working on effective solutions for the analysis of high-dimensional time-based and extremely large data as well as on breaking down the barriers between users and data by means of immersive analytics. We develop web- and cloud-based solutions for visual analytics as well as methods to provide visual analytics with meaningful statistical control mechanisms and thus make visualizations more "trustworthy".

High-dimensional time-based data
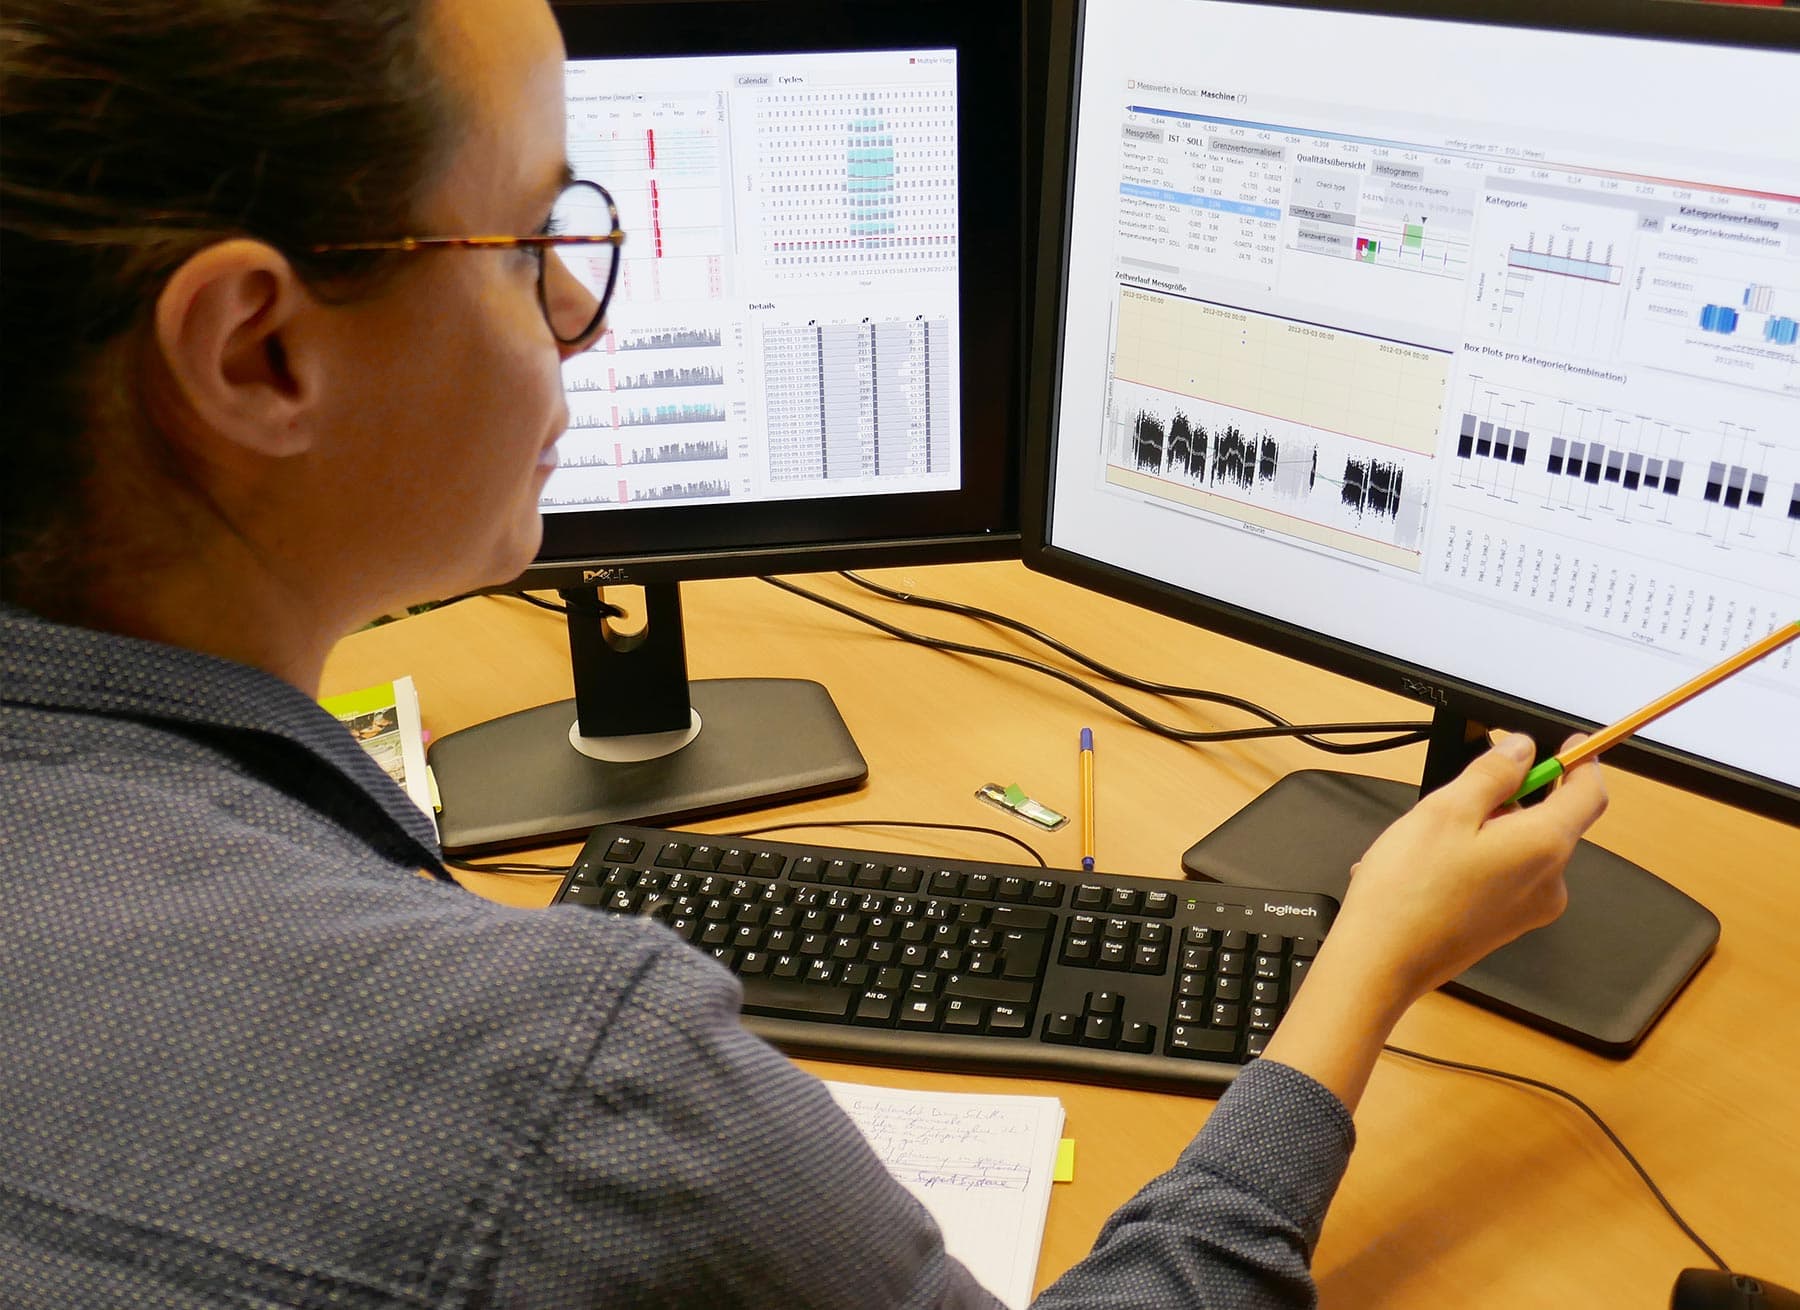
High-dimensional time-based data, such as those generated in Internet-of-Things (IoT) and Industry 4.0 applications, pose many challenges to research due to their sheer volume and size. We develop new visualization techniques or make existing ones more effective to make this data visible and readable.

Immersive analytics
In the field of immersive analytics, we are looking at how we can think further about analysis processes and detach them from the conventional desktop computer. In order to build more efficient bridges between the user and the data, we are primarily asking ourselves technical questions: In what ways can data be displayed? How can interaction with data beyond keyboard and computer mouse still work and for which application purposes does this make sense?
Web and cloud-based solutions
As more and more data accumulates in the industry, which is also more frequently stored in a centralized manner nowadays, the importance of web and cloud-based solutions continues to grow. Such solutions are also convenient for users: everything is in one place and, at best, accessible through a web browser (which is always available). At VRVis we create real solutions for the industry and optimize network traffic or research particularly user-friendly interaction systems.

Trustworthy visualizations
In order to be able to deal with different problems adequately, we at VRVis are researching different visual methods that can be integrated into existing visual analytics tools. By equipping visual analytics with statistical control mechanisms, we contribute to the design of "trustworthy" visualizations.

Visual analytics for ensemble simulations
Since 2005, we have been working intensively on future-oriented applications of visual analytics for ensemble simulations. In the context of the cooperation with our industry partner AVL, we were able to develop innovative visualization methods and completely new explorative analysis methods for simulation results in the automotive industry, which can also be translated to other industries and research fields that work with a large number of data and parameters.

Visual parameter space analyses
Visual parameter space analyses are of great importance when working with simulation models, since a large amount of available input and output data has to be made understandable in all its complexity. At VRVis, we develop tools to accelerate simulation processes by and with these analyses: e.g. by using the visual analysis of the respective parameters to provide information in advance about the meaningfulness or success of the simulation result.

Visual analytic methods for big data exploration
Modern imaging techniques help to better understand biological processes using massive amounts of data. In the life sciences, visual-analytical methods for exploring large data volumes can therefore help to improve the understanding of data and optimize analysis workflows. In this context, we not only take care of the design of applications that allow the most effective answering of scientific questions, but also of the associated data preparation, statistical analysis and indexing, as well as the development of high-performance data structures.

Visual analytics of climate data
The role of visual analytics in the analysis of climate and weather data will be an even greater one in the future, as it is the only way to capture the complex interrelationships in their entirety and use them for better climate change adaptation solutions. VRVis has several experts specialized in climate and environmental data, for example working with Typical Meterological Year (TMY) time series or developing visual cockpits for biosolar technology performance assessment.

Visual analytics for energy data
Austria has relied heavily on hydropower for many years, using renewable energy for a climate-friendly future. Some hydropower plants are older structures and need retrofitting with modern sensors and data analytics to create a modern and sustainable digital hydropower twin. Visual analytics and intuitive visualization dashboards make real-time monitoring and better maintenance possible.

In our research work within the HILITE and Sharc projects, we develop tools and methods that optimize simulation workflows for interactive lighting design. Since the processing of enormous amounts of data of different origin - quality of light sources, angles, spatial situation, etc. - has to be taken into account, we use principles of visual parameter space analysis to massively accelerate the workflow on the one hand and to compute automatically generated suggestions for improvement of lighting situations on the other hand. These research projects emphasize the necessity of the interplay between spatial and abstract data worlds to make such and similar analyses possible in the first place.

At VRVis we successfully use visual analytics methods to help physicians and scientists explore complex, heterogeneous data in medicine and the life sciences. These data come, for example, from studies on patient cohorts and observations, behavioral data from animal experiments, gene data, but also, for example, from large collections of spatial measurement, image and network data on the brain. Our visual analytics solutions help when initial hypotheses are to be developed based on large amounts of data, but also when there is not enough data to develop meaningful statistical results and models. Examples of our work include a visual analytics framework that supports the search for biomarkers for very rare childhood cancers (Visual Analytics and Data Science for Healthcare and Medical Research and VISIOMICS) and comprehensive data management, data mining and visual analytics solutions for neuroscience, some of which are in use worldwide (Neuroscience - Visual Computing, Data Science and Big Data and Brain*).

The HEROD project employs a combination of sensor technologies, data analytics, ontologies, and visual computing to improve predictability and quality assurance in 3D printing.
On the way to sustainable, climate-neutral cities, the EU project GREENGAGE is developing innovative technology solutions, for better population participation in the issues of mobility, air quality and healthy living.
The project REINFORCE researches how reinforcement learning and human-centered visualization methods can be used to solve complex control problems in an efficient, fast, and flexible way.
The Rail4Future project is focusing on the design of a digital rail system for the future. To this end, a novel and fully virtual validation platform for large-scale simulations of entire rail lines is being developed to increase the efficiency of existing rail infrastructure.
The aim of the application project IVC Multi is to research novel intelligent visual computing methods supporting decision-making in automotive industry, medicine, and life sciences based on ensembles of heterogeneous, multi-scale and/or multi-temporal data.
The strategic project of the area is the organizational and scientific hub for the realization of the area-wide intelligent visual computing approach for analytics and modelling based on ensembles of dense grid-based data, derived data, and digital embedding.
The primary goal of project INGRESS is to accelerate and improve the process of data scientists working with Industry 4.0 and Internet of Things (IoT) data, by enabling a closer integration of visual analysis into the existing workflows.
The RAILING project deals with the research and development of interactive, scalable and trust-building visualization and analysis tools for the exploration of time-dependent and complex data.
Within the project Larvalbrain 2.0, a dynamic multi-scale multi-level atlas and data collection of structural, molecular, physiological, and behavioral results of Drosophila melanogaster larvae will be established.
Training AI algorithms requires a great amount of data. However, raw data often contains sensitive information. Homomorphic encryption offers a solution for secure machine learning - with protected sensitive data.
Renewable energies, such as hydropower, are an essential backbone for a climate-friendly future. To enable better real-time monitoring and thus maintenance of hydropower infrastructure, innovative digital hydropower twins are being developed in this project.
The goal of the applied research project En2VA (“Visual Analytics for Energy and Engineering Applications”) is to increase the efficiency and the quality of advanced analytics for high-dimensional data from manufacturing, engineering, and the energy sector.
DEXHELPP develops new methods to support analysis, planning and control in health care by combining decision analysis, data security, data management, statistics, mathematical modelling, simulation and visual analysis.