
From data preparation to analysis - at VRVis we are familiar with the Data Science pipeline* and are researching new methods and applications that optimally complement this pipeline.
Model: Build an abstract representation (a model) of the data - this can be an AI model, but can also be a simpler representation like a categorization, clustering, regression. Models of the data tell us more about the structure of the data and allow us to make predictions. In our Artificial Intelligence research we focus on teaching computer systems by machine learning or deep learning based on large volumes of training data to behave intelligently, analyze their environment and take decisions autonomously.
* See Data Science Flow by: Kandel, S., Paepcke, A., Hellerstein, J.M., and Heer, J. (2012). Enterprise Data Analysis and Visualization: An Interview Study. IEEE Transactions on Visualization and Computer Graphics 18(12): 2917-2926
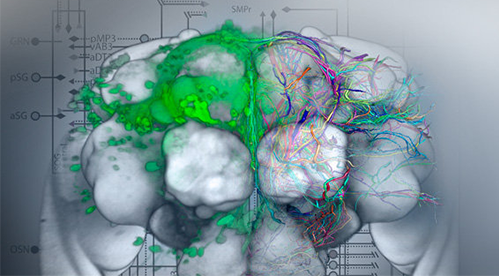
Data Science plays an increasing role in the fields of medicine and life sciences. VRVis has already successfully implemented several data science projects in the areas of neuroscience and medicine for the analysis of health and patient cohort data. Furthermore, VRVis has developed Brain*, a globally used platform for the integration, management and exploration of spatial brain data.

As a key technology in the field of industrial production, visual analytics enables us to see through the data surrounding the production process through visual data analysis. In this context, the stability and scalability of visual analytics tools are crucial factors for their acceptance as reliable tools in Industry 4.0, such as in our INGRESS project. Our analytics solutions are characterized by their ability to handle complex data, as well as to perform pattern search and anomaly detection quickly and reliably. In the EDIH AI5production project we support companies in their digital transformation with know-how about human-centered AI and data science solutions.

Hydropower is an important part of Austrian renewable energy. However, many hydropower plants are older structures. In our DIGI-Hydro project, a hydropower plant is retrofitted with new measurement sensors and advanced data analytics to facilitate real-time monitoring and better maintenance with the help of a digital (hydropower) twin.

Data Science of climate data
The role of visual analytics in the analysis of climate and weather data will be an even greater one in the future, as it is the only way to capture the complex interrelationships in their entirety and use them for better climate change adaptation solutions. VRVis has several experts specialized in climate and environmental data, for example working with Typical Meterological Year (TMY) time series or developing visual cockpits for biosolar technology performance assessment.

To enable people to live an economically, ecologically and socially sustainable life, applications by VRVis contribute to 10 of the 17 Sustainable Development Goals (SDGs). Due to this, VRVis is now nominated for the Austrian SDG-Award.
On March 3, 2020, Katja Bühler, head of our Biomedical Image Informatics Group, was awarded with the renowned TU Women's Prize.
Johanna Schmidt and Sophia Ulonska are nominated for the Hedy Lamarr Award by the city of Vienna.
VRVis gets awarded with the CGI Best Short Paper Award 2019!
The web-based tool "neuroMAP" of VRVis and IMP received the Best Paper Award of the IEEE BioVis 2013.
The HEROD project employs a combination of sensor technologies, data analytics, ontologies, and visual computing to improve predictability and quality assurance in 3D printing.
In this WWTF-funded project, VRVis is developing a roadmap that will serve as the basis for positioning visual computing as a key enabling technology for the real-world implementation of digital humanism.
In the European Digital Innovation Hub "AI5production", 17 renowned scientific institutions have joined forces to support manufacturing companies on their digitalization journey with the help of AI technologies.
The aim of the application project IVC Multi is to research novel intelligent visual computing methods supporting decision-making in automotive industry, medicine, and life sciences based on ensembles of heterogeneous, multi-scale and/or multi-temporal data.
The strategic project of the area is the organizational and scientific hub for the realization of the area-wide intelligent visual computing approach for analytics and modelling based on ensembles of dense grid-based data, derived data, and digital embedding.
The primary goal of project INGRESS is to accelerate and improve the process of data scientists working with Industry 4.0 and Internet of Things (IoT) data, by enabling a closer integration of visual analysis into the existing workflows.
The RAILING project deals with the research and development of interactive, scalable and trust-building visualization and analysis tools for the exploration of time-dependent and complex data.
Within the project Larvalbrain 2.0, a dynamic multi-scale multi-level atlas and data collection of structural, molecular, physiological, and behavioral results of Drosophila melanogaster larvae will be established.
DEXHELPP develops new methods to support analysis, planning and control in health care by combining decision analysis, data security, data management, statistics, mathematical modelling, simulation and visual analysis.
Businesses go smart with Data Science: with the help of visual data analysis, machine learning, deep learning, data mining and visual data processing we help companies to fully exploit the potential of their data.
In this project we develop new methods from the field of visual analysis and machine learning to automate the quality control and quality assurance of glass articles.
The combination of "liquid biopsies", machine learning and data visualization aims to enable earlier and more accurate prediction of a relapse in children with cancer.
The strategic project forms the organizational and scientific hub for the realization of an area wide integrative visual computing approach. It covers joint strategic research and development on fundamental challenges in all application projects.
For centuries, neuroscientists have been mapping the brain. Until now, the step from simple maps to a generally accepted model has proved to be extremely difficult. In this project, a 4D atlas of the brain of the fruit fly larva is being built.
VRVis contributes data analytics and visualization tools tailored to support and accelerate research of the Haubensak Group at the Institute of Molecular Pathology Vienna.